
Practice Free SPLK-1005 Exam Online Questions
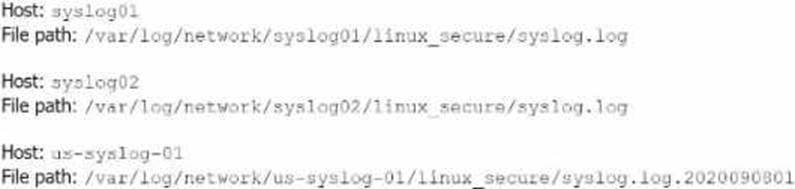
Li was asked to create a Splunk configuration to monitor syslog files stored on Linux servers at their organization. This configuration will be pushed out to multiple systems via a Splunk app using the on-prem deployment server.
The system administrators have provided Li with a directory listing for the logging locations on three syslog hosts, which are representative of the file structure for all systems collecting this data.
An example from each system is shown below:
A)
![]()
B)
![]()
C)
![]()
D)
![]()
- A . Option A
- B . Option B
- C . Option C
- D . Option D
A
Explanation:
The correct monitor statement that will capture all variations of the syslog file paths across different systems is [monitor:///var/log/network/syslog*/linux_secure/*].
This configuration works because:
syslog* matches directories that start with "syslog" (like syslog01, syslog02, etc.).
The wildcard * after linux_secure/ will capture all files within that directory, including different filenames like syslog.log and syslog.log.2020090801.
This setup will ensure that all the necessary files from the different syslog hosts are monitored. Splunk Documentation
Reference: Monitor files and directories
When monitoring network inputs, there will be times when the forwarder is unable to send data to the indexers. Splunk uses a memory queue and a disk queue.
Which setting is used for the disk queue?
- A . queueSize
- B . maxQeueSize
- C . diskQiioiioiiizo
- D . persistentQueueSize
D
Explanation:
When a forwarder is unable to send data to indexers, it queues the data in memory and optionally on disk. The setting used for the disk queue is persistentQueueSize. This configuration defines the size of the disk queue that stores data temporarily on the forwarder when it cannot immediately forward the data to an indexer.
Splunk Documentation
Reference: Configure forwarding and receiving in Splunk
In case of a Change Request, which of the following should submit a support case for Splunk Support?
- A . The party requesting the change.
- B . Certified Splunk Cloud administrator.
- C . Splunk infrastructure owner.
- D . Any person with the appropriate entitlement
D
Explanation:
In Splunk Cloud, when there is a need for a change request that might involve modifying settings, upgrading, or other actions requiring Splunk Support, the process typically requires submitting a support case.
D. Any person with the appropriate entitlement: This is the correct answer. Any individual who has the necessary permissions or entitlements within the Splunk environment can submit a support case.
This includes administrators or users who have been granted the ability to engage with Splunk Support. The request does not necessarily have to come from a Certified Splunk Cloud Administrator or the infrastructure owner; rather, it can be submitted by anyone with the correct level of access.
Splunk Documentation
Reference: Submitting a Splunk Support Case
Managing User Roles and Entitlements
Which of the following is an accurate statement about the delete command?
- A . The delete command removes events from disk.
- B . By default, only admins can run the delete command.
- C . Events are virtually deleted by marking them as deleted.
- D . Deleting events reclaims disk space.
C
Explanation:
The delete command in Splunk does not remove events from disk but rather marks them as "deleted" in the index. This means the events are not accessible via searches, but they still occupy space on disk. Only users with the can_delete capability (typically admins) can use the delete
command.
Splunk Documentation
Reference: Delete Command
What information is identified during the input phase of the ingestion process?
- A . Line breaking and timestamp.
- B . A hash of the message payload.
- C . Metadata fields like sourcetype and host.
- D . SRC and DST IP addresses and ports.
C
Explanation:
During the input phase, Splunk assigns metadata fields such as sourcetype, host, and source, which are critical for data categorization and routing. [Reference: Splunk Docs on data ingestion stages]
In which of the following situations should Splunk Support be contacted?
- A . When a custom search needs tuning due to not performing as expected.
- B . When an app on Splunkbase indicates Request Install.
- C . Before using the delete command.
- D . When a new role that mirrors sc_admin is required.
B
Explanation:
In Splunk Cloud, when an app on Splunkbase indicates "Request Install," it means that the app is not available for direct self-service installation and requires intervention from Splunk Support. This could be because the app needs to undergo an additional review for compatibility with the managed cloud environment or because it requires special installation procedures.
In these cases, customers need to contact Splunk Support to request the installation of the app. Support will ensure that the app is properly vetted and compatible with Splunk Cloud before proceeding with the installation.
Splunk Cloud
Reference: For further details, consult Splunk’s guidelines on requesting app
installations in Splunk Cloud and the processes involved in reviewing and approving apps for use in
the cloud environment.
Source:
Splunk Docs: Install apps in Splunk Cloud Platform
Splunkbase: App request procedures for Splunk Cloud
What is the recommended method to test the onboarding of a new data source before putting it in production?
- A . Send test data to a test index.
- B . Send data to the associated production index.
- C . Replicate Splunk deployment in a test environment.
- D . Send data to the chance index.
A
Explanation:
The recommended method to test the onboarding of a new data source before putting it into production is to send test data to a test index. This approach allows you to validate data parsing, field extractions, and indexing behavior without affecting the production environment or data. Splunk Documentation
Reference: Onboarding New Data Sources
Given the following set of files, which of the monitor stanzas below will result in Splunk monitoring all of the files ending with .log?
Files:
/var/log/www1/secure.log
/var/log/www1/access.log
/var/log/www2/logs/secure.log
/var/log/www2/access.log
/var/log/www2/access.log.1
- A . [monitor:///var/log/*/*.log]
- B . [monitor:///var/log/…/*.log]
- C . [monitor:///var/log/*/*]
- D . [monitor:///var/log/…/*]
B
Explanation:
The ellipsis (…) in [monitor:///var/log/…/*.log] allows Splunk to monitor files ending in .log in all nested directories under /var/log/. [Reference: Splunk Docs on monitor stanza syntax]
What is the name of the Splunk index that contains the most valuable information for troubleshooting a Splunk issue?
- A . _internal
- B . lastchanceindex
- C . _monitoring
- D . defaultdb
A
Explanation:
The _internal index stores logs that are valuable for troubleshooting, including information about system operations, indexers, and search head logs. This index provides insights necessary to diagnose many common issues. [Reference: Splunk Docs on indexes]
How are HTTP Event Collector (HEC) tokens configured in a managed Splunk Cloud environment?
- A . Any token will be accepted by HEC, the data may just end up in the wrong index.
- B . A token is generated when configuring a HEC input, which should be provided to the application developers.
- C . Obtain a token from the organization’s application developers and apply it in Settings > Data Inputs > HTTP Event Collector > New Token.
- D . Open a support case for each new data input and a token will be provided.
B
Explanation:
In a managed Splunk Cloud environment, HTTP Event Collector (HEC) tokens are configured by an administrator through the Splunk Web interface. When setting up a new HEC input, a unique token is automatically generated. This token is then provided to application developers, who will use it to authenticate and send data to Splunk via the HEC endpoint.
This token ensures that the data is correctly ingested and associated with the appropriate inputs and indexes. Unlike the other options, which either involve external tokens or support cases, option B reflects the standard procedure for configuring HEC tokens in Splunk Cloud, where control over tokens remains within the Splunk environment itself.
Splunk Cloud
Reference: Splunk’s documentation on HEC inputs provides detailed steps on creating and managing tokens within Splunk Cloud. This includes the process of generating tokens, configuring data inputs, and distributing these tokens to application developers. Source:
Splunk Docs: HTTP Event Collector in Splunk Cloud Platform
Splunk Docs: Create and manage HEC tokens