
Practice Free PL-100 Exam Online Questions
You are creating a model-driven app that allows users to create and edit a list of existing accounts.
You need to display a list of all active accounts.
Which user interface components should you use?
- A . view
- B . gallery
- C . data table
- D . form
A
Explanation:
Imagine that you have a collection of data (such as a list sales orders, a set of service tickets, or a directory of contacts), and that you want to show this data in your Microsoft PowerApps app in a tabular format, where each column represents a field and each row represents a record. In the past, you might have been able to roughly simulate this visualization, although the process required some effort. However, we’ve been listening to your requests and are happy to announce that you can now quickly and easily achieve this very typical visualization by using the new Data table control that has been recently added to PowerApps.
Reference: https://powerapps.microsoft.com/fr-fr/blog/introducing-the-data-table-control/
DRAG DROP
You create an app with multiple screens.
Test users report that the size and type of gallery displayed on each screen are different. You must improve the consistency for the app screens.
You need to create a reusable gallery that displays information based on the current record.
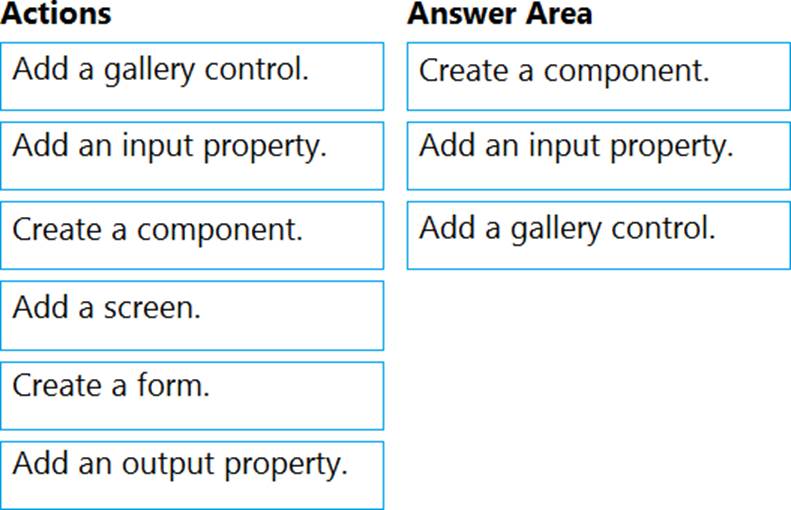
Which three actions should you perform in sequence? To answer, move the appropriate actions from the list of actions to the answer area and arrange them in the correct order. NOTE: More than one order of answer choices is correct. You will receive credit for any of the correct orders you select.

Explanation:
– Create a component
– Add an input property
– Add a gallery control
From https://docs.microsoft.com/en-us/powerapps/maker/canvas-apps/create-component
step 10 and 11
DRAG DROP
You have a model-driven app that has an entity named Marinas. You have an entity named Boats that list the boats associated with each marina.
You must add a list of boats to the Marinas form. You must also add an option for users to select different views including boat owners and marina members.
You need to embed the list of boats associated with a Marina record in the entity form.
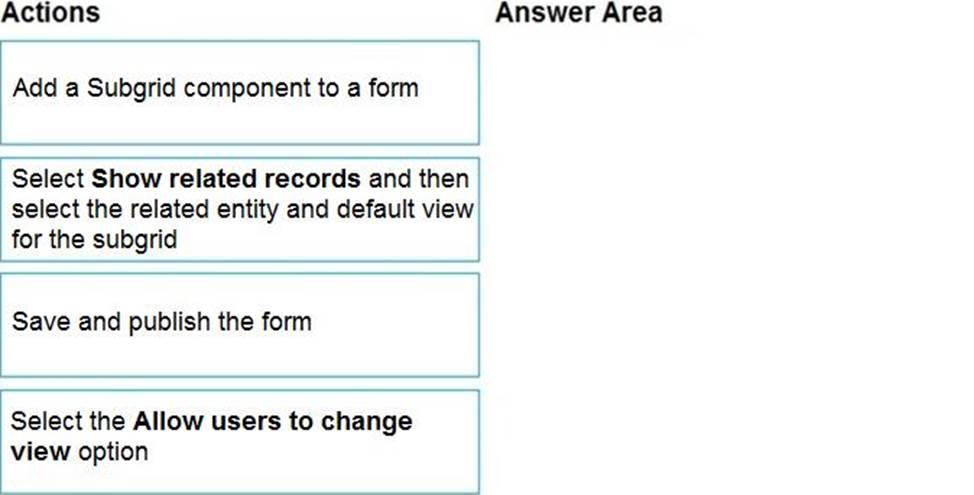
In which order should you perform the actions? To answer, move all actions from the list of actions to the answer area and arrange them in the correct order.
Explanation:
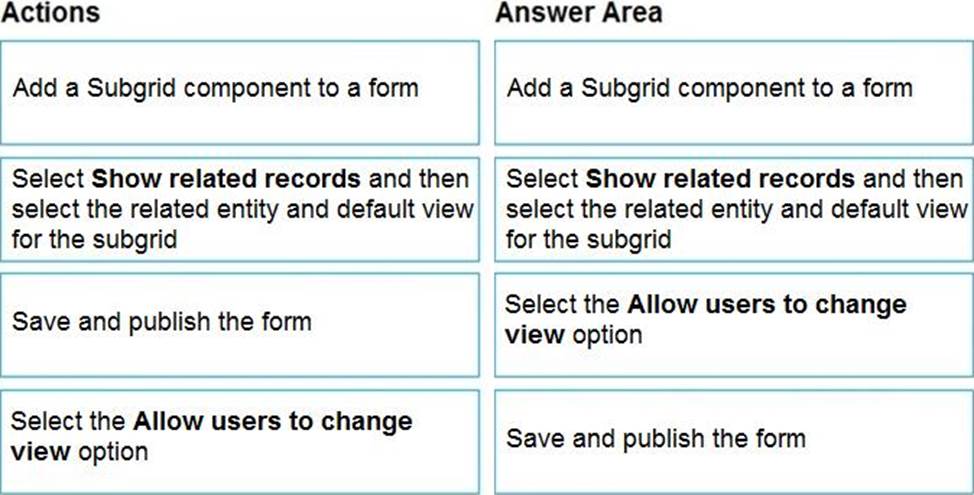
Step 1: Add a Subgrid component to a form
You add a subgrid component the same way as you add any other component.
Step 2: Select Show related records and then select the related entity and default view for the subgrid
Configure a subgrid component.
Properties available to configure when using a subgrid component on a form using the form designer include:
✑ Show related rows
When selected, the subgrid displays only rows related to the current row that is displayed on the form.
Step 3: Select the Allow users to change view option Configure a subgrid component.
Properties available to configure when using a subgrid component on a form using the form designer include:
✑ Allow users to change view
When selected, app users can change from the Default view to another view of the table selected in the Table property.
Step 4: Save and publish the form
Reference: https://docs.microsoft.com/en-us/powerapps/maker/model-driven-apps/form-designer-add-configure-subgrid
Note: This question is part of a series of questions that present the same scenario. Each question in the series contains a unique solution that might meet the stated goals. Some question sets might have more than one correct solution, while others might not have a correct solution.
After you answer a question in this section, you will NOT be able to return to it. As a result, these questions will not appear in the review screen.
A company has locations in multiple countries and regions across four continents.
The company stores the total amount of each order in the local currency of the country/region where the customer is located. The company stores the applicable exchange rates in a custom US dollars (USD) exchange rate table.
You need to create a visualization that displays the total amount of orders by country/region in USD.
Proposed solution:
Create a custom calculated field of type currency on the order table that converts the order total to USD and displays the total amounts by region in a Power BI chart.
Does the solution meet the goal?
- A . Yes
- B . No
A
Explanation:
Instead use a calculated field.
Need to calculate the exchange rate in USD.
Calculated columns are calculated in real-time when they are retrieved.
Reference: https://docs.microsoft.com/en-us/powerapps/developer/data-platform/calculated-rollup-attributes
DRAG DROP
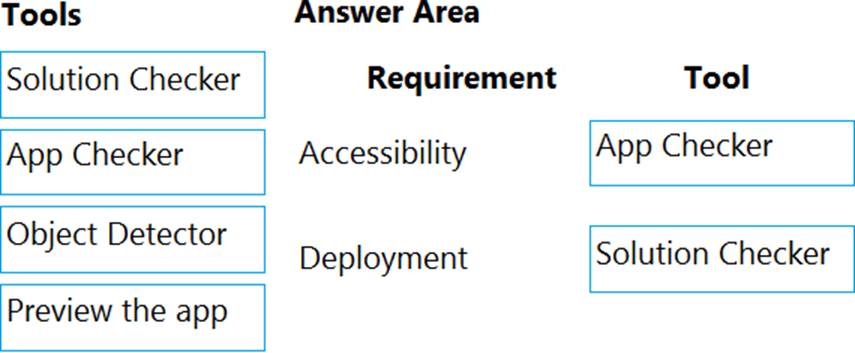
You need to ensure that the app can support the needs of User2 and User3, and meets the production deployment requirements.
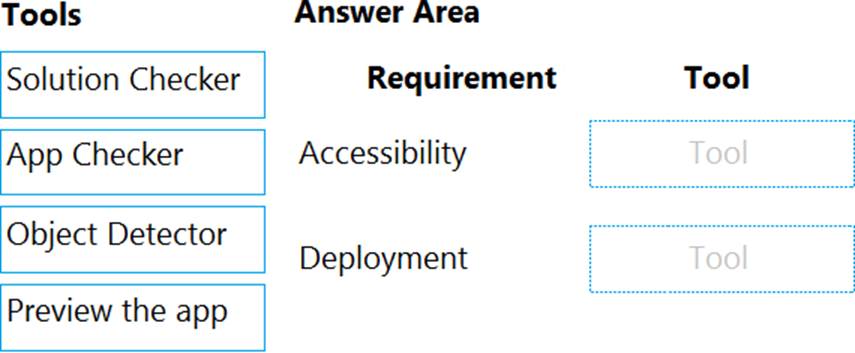
Which tools should you use? To answer, select the appropriate tool in the answer area. NOTE: Each correct selection is worth one point.
Explanation:
Box 1: App Checker
Scenario: Several sales representatives have accessibility restrictions. User2 is visually impaired and cannot see images. User3 is unable to use a mouse.
Users who have vision, hearing, or other impairments can use your canvas app more easily and successfully if you consider accessibility as you design how the app looks and behaves. If you’re not sure how to make your app more accessible, you can run the AppChecker Accessibility checker in Power Apps Studio.
Box 2: Solution Checker
Scenario: Before deploying the app to production, you must ensure that the app conforms to Microsoft accessibility and performance guidelines.
Use solution checker to validate your model-driven apps in Power Apps.
Reference:
https://docs.microsoft.com/en-us/powerapps/maker/canvas-apps/accessibility-checker
https://docs.microsoft.com/en-us/powerapps/maker/common-data-service/use-powerapps-checker
You configure Dataverse security as follows:
• User1 does not have privileges to TableA.
• Team! has read and write privileges to TableA at a user level.
• Team2 has read privileges to TableA at an organization level.
User1 needs read and write privileges to a record in TableA The user who owns TableA has the system administrator role and is not a member of Team1 or Team2. You need to provide User1 read and write access to the record.
What should you do?
- A . Ask the record owner to create an access team and add User1 with read and write privileges.
- B . Ask a Team1 user to share the record with User1.
- C . Add User1 toTeam2.
- D . Assign the System Customizer role to User1.
HOTSPOT
You need to select data types for the app.
Which data type should you use? To answer, select the appropriate options in the answer area. NOTE: Each correct selection is worth one point.
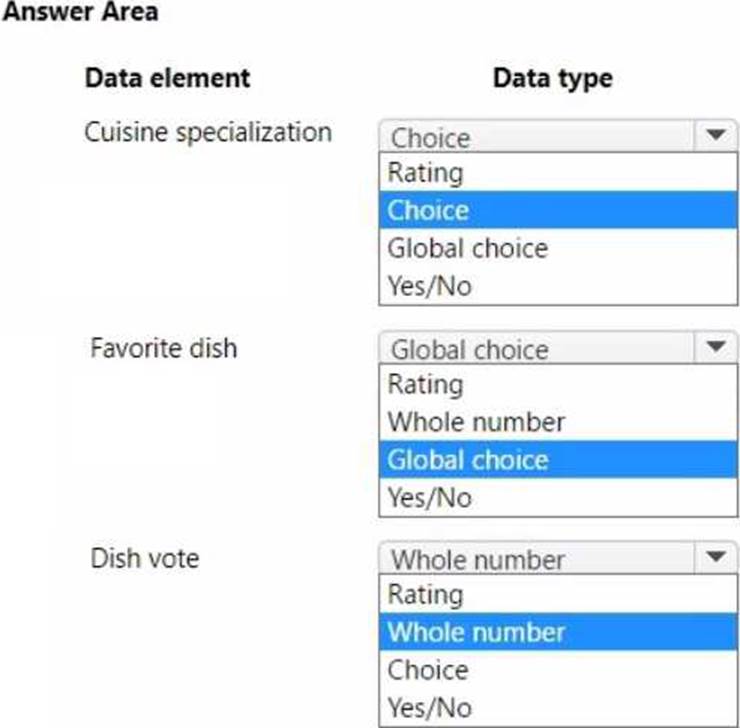
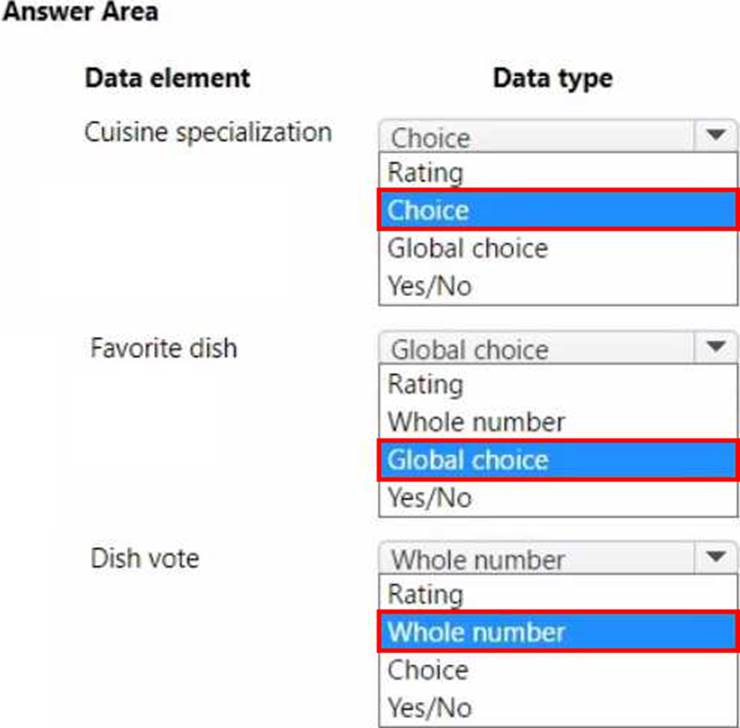
HOTSPOT
You need to select data types for the app.
Which data type should you use? To answer, select the appropriate options in the answer area. NOTE: Each correct selection is worth one point.
Note: This question is part of a series of questions that present the same scenario. Each question in the series contains a unique solution that might meet the stated goals. Some question sets might have more than one correct solution, while others might not have a correct solution.
After you answer a question in this section, you will NOT be able to return to it. As a result, these questions will not appear in the review screen.
A company has locations in multiple countries and regions across four continents.
The company stores the total amount of each order in the local currency of the country/region where the customer is located. The company stores the applicable exchange rates in a custom US dollars (USD) exchange rate table.
You need to create a visualization that displays the total amount of orders by country/region in USD.
Proposed solution:
Create a custom column that converts the order total to USD by using the relationship between order local currency and the USD exchange rate table in Power BI Desktop and display this column in a Power BI chart by country/region.
Does the solution meet the goal?
- A . Yes
- B . No
B
Explanation:
Instead use a calculated field.
Need to calculate the exchange rate in USD.
Calculated columns are calculated in real-time when they are retrieved.
Reference: https://docs.microsoft.com/en-us/powerapps/developer/data-platform/calculated-rollup-attributes