
Practice Free FCSS_SOC_AN-7.4 Exam Online Questions
What is a key consideration when managing playbook templates for SOC automation?
- A . The color coordination of playbook interfaces
- B . The comprehensiveness and adaptability of the templates
- C . The entertainment value of playbook simulations
- D . The popularity of templates among SOC analysts
While monitoring your network, you discover that one FortiGate device is sending significantly more logs to FortiAnalyzer than all of the other FortiGate devices in the topology.
Additionally, the ADOM that the FortiGate devices are registered to consistently exceeds its quota.
What are two possible solutions? (Choose two.)
- A . Increase the storage space quota for the first FortiGate device.
- B . Create a separate ADOM for the first FortiGate device and configure a different set of storage policies.
- C . Reconfigure the first FortiGate device to reduce the number of logs it forwards to FortiAnalyzer.
- D . Configure data selectors to filter the data sent by the first FortiGate device.
BC
Explanation:
Understanding the Problem:
One FortiGate device is generating a significantly higher volume of logs compared to other devices, causing the ADOM to exceed its storage quota.
This can lead to performance issues and difficulties in managing logs effectively within FortiAnalyzer.
Possible Solutions:
The goal is to manage the volume of logs and ensure that the ADOM does not exceed its quota, while still maintaining effective log analysis and monitoring.
Solution A: Increase the Storage Space Quota for the First FortiGate Device:
While increasing the storage space quota might provide a temporary relief, it does not address the root cause of the issue, which is the excessive log volume.
This solution might not be sustainable in the long term as log volume could continue to grow.
Not selected as it does not provide a long-term, efficient solution.
Solution B: Create a Separate ADOM for the First FortiGate Device and Configure a Different Set of
Storage Policies:
Creating a separate ADOM allows for tailored storage policies and management specifically for the high-log-volume device.
This can help in distributing the storage load and applying more stringent or customized retention and storage policies.
Selected as it effectively manages the storage and organization of logs.
Solution C: Reconfigure the First FortiGate Device to Reduce the Number of Logs it Forwards to
FortiAnalyzer:
By adjusting the logging settings on the FortiGate device, you can reduce the volume of logs forwarded to FortiAnalyzer.
This can include disabling unnecessary logging, reducing the logging level, or filtering out less critical logs.
Selected as it directly addresses the issue of excessive log volume.
Solution D: Configure Data Selectors to Filter the Data Sent by the First FortiGate Device:
Data selectors can be used to filter the logs sent to FortiAnalyzer, ensuring only relevant logs are forwarded.
This can help in reducing the volume of logs but might require detailed configuration and regular updates to ensure critical logs are not missed.
Not selected as it might not be as effective as reconfiguring logging settings directly on the FortiGate
device.
Implementation Steps:
For Solution B:
Step 1: Access FortiAnalyzer and navigate to the ADOM management section.
Step 2: Create a new ADOM for the high-log-volume FortiGate device.
Step 3: Register the FortiGate device to this new ADOM.
Step 4: Configure specific storage policies for the new ADOM to manage log retention and storage.
For Solution C:
Step 1: Access the FortiGate device’s configuration interface.
Step 2: Navigate to the logging settings.
Step 3: Adjust the logging level and disable unnecessary logs.
Step 4: Save the configuration and monitor the log volume sent to FortiAnalyzer.
Reference: Fortinet Documentation on FortiAnalyzer ADOMs and log management FortiAnalyzer Administration Guide
Fortinet Knowledge Base on configuring log settings on FortiGate FortiGate Logging Guide
By creating a separate ADOM for the high-log-volume FortiGate device and reconfiguring its logging
settings, you can effectively manage the log volume and ensure the ADOM does not exceed its quota.
Refer to Exhibit:
You are tasked with reviewing a new FortiAnalyzer deployment in a network with multiple registered logging devices. There is only one FortiAnalyzer in the topology.
Which potential problem do you observe?
- A . The disk space allocated is insufficient.
- B . The analytics-to-archive ratio is misconfigured.
- C . The analytics retention period is too long.
- D . The archive retention period is too long.
B
Explanation:
Understanding FortiAnalyzer Data Policy and Disk Utilization:
FortiAnalyzer uses data policies to manage log storage, retention, and disk utilization.
The Data Policy section indicates how long logs are kept for analytics and archive purposes.
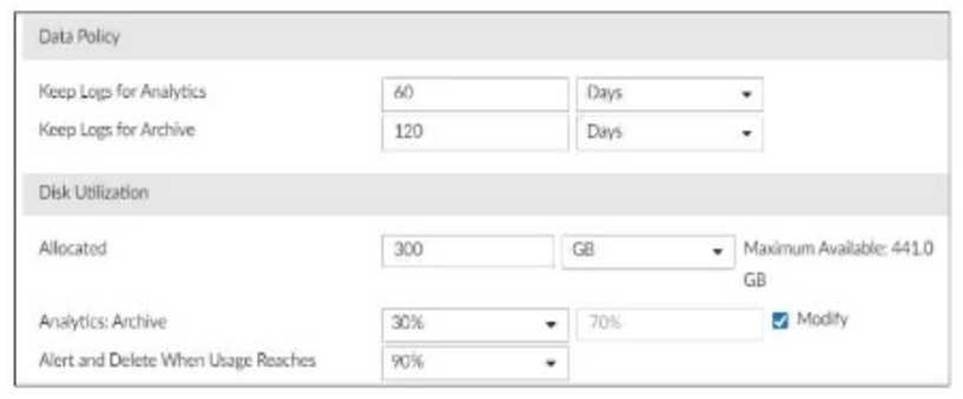
The Disk Utilization section specifies the allocated disk space and the proportions used for analytics and archive, as well as when alerts should be triggered based on disk usage. Analyzing the Provided Exhibit:
Keep Logs for Analytics: 60 Days
Keep Logs for Archive: 120 Days
Disk Allocation: 300 GB (with a maximum of 441 GB available)
Analytics: Archive Ratio: 30% : 70%
Alert and Delete When Usage Reaches: 90%
Potential Problems Identification:
Disk Space Allocation: The allocated disk space is 300 GB out of a possible 441 GB, which might not be insufficient if the log volume is high, but it is not the primary concern based on the given data. Analytics-to-Archive Ratio: The ratio of 30% for analytics and 70% for archive is unconventional. Typically, a higher percentage is allocated for analytics since real-time or recent data analysis is often prioritized. A common configuration might be a 70% analytics and 30% archive ratio. The misconfigured ratio can lead to insufficient space for analytics, causing issues with real-time monitoring and analysis.
Retention Periods: While the retention periods could be seen as lengthy, they are not necessarily indicative of a problem without knowing the specific log volume and compliance requirements. The length of these periods can vary based on organizational needs and legal requirements. Conclusion:
Based on the analysis, the primary issue observed is the analytics-to-archive ratio being misconfigured. This misconfiguration can significantly impact the effectiveness of the FortiAnalyzer in real-time log analysis, potentially leading to delayed threat detection and response.
Reference: Fortinet Documentation on FortiAnalyzer Data Policies and Disk Management.
Best Practices for FortiAnalyzer Log Management and Disk Utilization.
Refer to the exhibit.
Assume that all devices in the FortiAnalyzer Fabric are shown in the image.
Which two statements about the FortiAnalyzer Fabric deployment are true? (Choose two.)
- A . FortiGate-B1 and FortiGate-B2 are in a Security Fabric.
- B . There is no collector in the topology.
- C . All FortiGate devices are directly registered to the supervisor.
- D . FAZ-SiteA has two ADOMs enabled.
AD
Explanation:
Understanding the FortiAnalyzer Fabric:
The FortiAnalyzer Fabric provides centralized log collection, analysis, and reporting for connected FortiGate devices.
Devices in a FortiAnalyzer Fabric can be organized into different Administrative Domains (ADOMs) to
separate logs and management.
Analyzing the Exhibit:
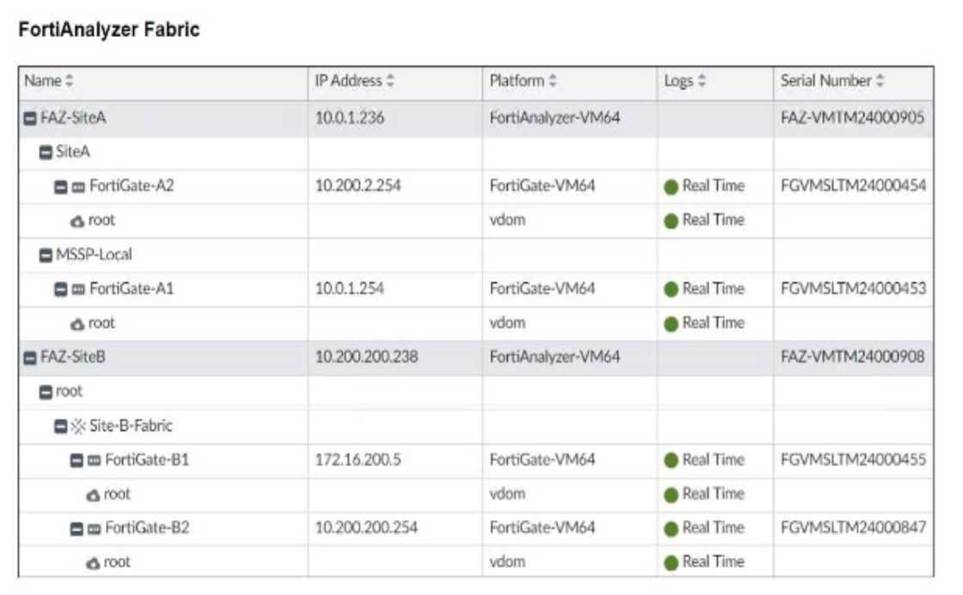
FAZ-SiteA and FAZ-SiteB are FortiAnalyzer devices in the fabric. FortiGate-B1 and FortiGate-B2 are shown under the Site-B-Fabric, indicating they are part of the same Security Fabric.
FAZ-SiteA has multiple entries under it: SiteA and MSSP-Local, suggesting multiple ADOMs are enabled.
Evaluating the Options:
Option A: FortiGate-B1 and FortiGate-B2 are under Site-B-Fabric, indicating they are indeed part of the same Security Fabric.
Option B: The presence of FAZ-SiteA and FAZ-SiteB as FortiAnalyzers does not preclude the existence of collectors. However, there is no explicit mention of a separate collector role in the exhibit.
Option C: Not all FortiGate devices are directly registered to the supervisor. The exhibit shows hierarchical organization under different sites and ADOMs.
Option D: The multiple entries under FAZ-SiteA (SiteA and MSSP-Local) indicate that FAZ-SiteA has
two ADOMs enabled.
Conclusion:
FortiGate-B1 and FortiGate-B2 are in a Security Fabric.
FAZ-SiteA has two ADOMs enabled.
Reference: Fortinet Documentation on FortiAnalyzer Fabric Topology and ADOM Configuration.
Best Practices for Security Fabric Deployment with FortiAnalyzer.
Refer to the exhibit.
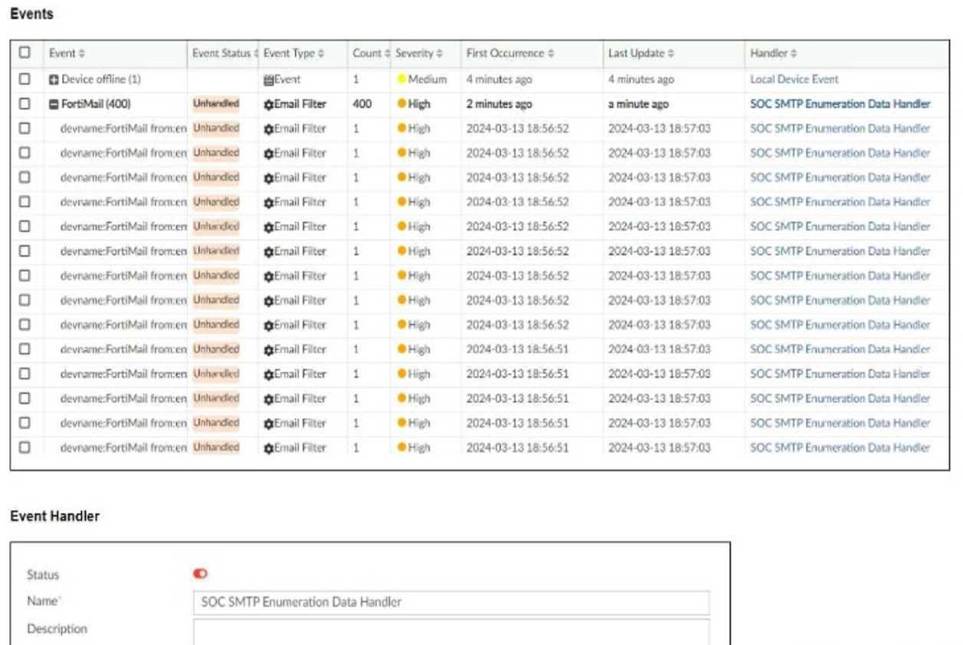
You notice that the custom event handler you configured to detect SMTP reconnaissance activities is creating a large number of events. This is overwhelming your notification system.
How can you fix this?
- A . Increase the trigger count so that it identifies and reduces the count triggered by a particular group.
- B . Disable the custom event handler because it is not working as expected.
- C . Decrease the time range that the custom event handler covers during the attack.
- D . Increase the log field value so that it looks for more unique field values when it creates the event.
A
Explanation:
Understanding the Issue:
The custom event handler for detecting SMTP reconnaissance activities is generating a large number of events.
This high volume of events is overwhelming the notification system, leading to potential alert fatigue
and inefficiency in incident response.
Event Handler Configuration:
Event handlers are configured to trigger alerts based on specific criteria.
The frequency and volume of these alerts can be controlled by adjusting the trigger conditions.
Possible Solutions:
According to the National Institute of Standards and Technology (NIST) cybersecurity framework, incident handling activities can be divided into phases.
In which incident handling phase do you quarantine a compromised host in order to prevent an adversary from using it as a stepping stone to the next phase of an attack?
- A . Containment
- B . Analysis
- C . Eradication
- D . Recovery
A
Explanation:
NIST Cybersecurity Framework Overview:
The NIST Cybersecurity Framework provides a structured approach for managing and mitigating
cybersecurity risks. Incident handling is divided into several phases to systematically address and
resolve incidents.
Incident Handling Phases:
Preparation: Establishing and maintaining an incident response capability.
Detection and Analysis: Identifying and investigating suspicious activities to confirm an incident.
Containment, Eradication, and Recovery:
Containment: Limiting the impact of the incident.
Eradication: Removing the root cause of the incident.
Recovery: Restoring systems to normal operation.
Containment Phase:
The primary goal of the containment phase is to prevent the incident from spreading and causing further damage.
Quarantining a Compromised Host:
Quarantining involves isolating the compromised host from the rest of the network to prevent adversaries from moving laterally and causing more harm.
Techniques include network segmentation, disabling network interfaces, and applying access controls.
Reference: NIST Special Publication 800-61, "Computer Security Incident Handling Guide" NIST Incident Handling
Detailed Process:
Step 1: Detect the compromised host through monitoring and analysis.
Step 2: Assess the impact and scope of the compromise.
Step 3: Quarantine the compromised host to prevent further spread. This can involve disconnecting the host from the network or applying strict network segmentation.
Step 4: Document the containment actions and proceed to the eradication phase to remove the threat completely.
Step 5: After eradication, initiate the recovery phase to restore normal operations and ensure that the host is securely reintegrated into the network. Importance of Containment:
Containment is critical in mitigating the immediate impact of an incident and preventing further damage. It buys time for responders to investigate and remediate the threat effectively.
Reference: SANS Institute, "Incident Handler’s Handbook" SANS Incident Handling
Reference: NIST Special Publication 800-61, "Computer Security Incident Handling Guide"
SANS Institute, "Incident Handler’s Handbook"
By quarantining a compromised host during the containment phase, organizations can effectively limit the spread of the incident and protect their network from further compromise.
What is the primary function of event handlers in a SOC operation?
- A . To provide technical support to end-users
- B . To automate responses to detected events
- C . To monitor the health of IT equipment
- D . To generate financial reports
What is the benefit of managing multiple FortiAnalyzer units in a Fabric deployment?
- A . It simplifies the licensing process
- B . It provides centralized management of configurations
- C . It reduces the physical space required for hardware
- D . It enhances the aesthetics of the deployment
Refer to the exhibits.
What can you conclude from analyzing the data using the threat hunting module?
- A . Spearphishing is being used to elicit sensitive information.
- B . DNS tunneling is being used to extract confidential data from the local network.
- C . Reconnaissance is being used to gather victim identity information from the mail server.
- D . FTP is being used as command-and-control (C&C) technique to mine for data.
B
Explanation:
Understanding the Threat Hunting Data:
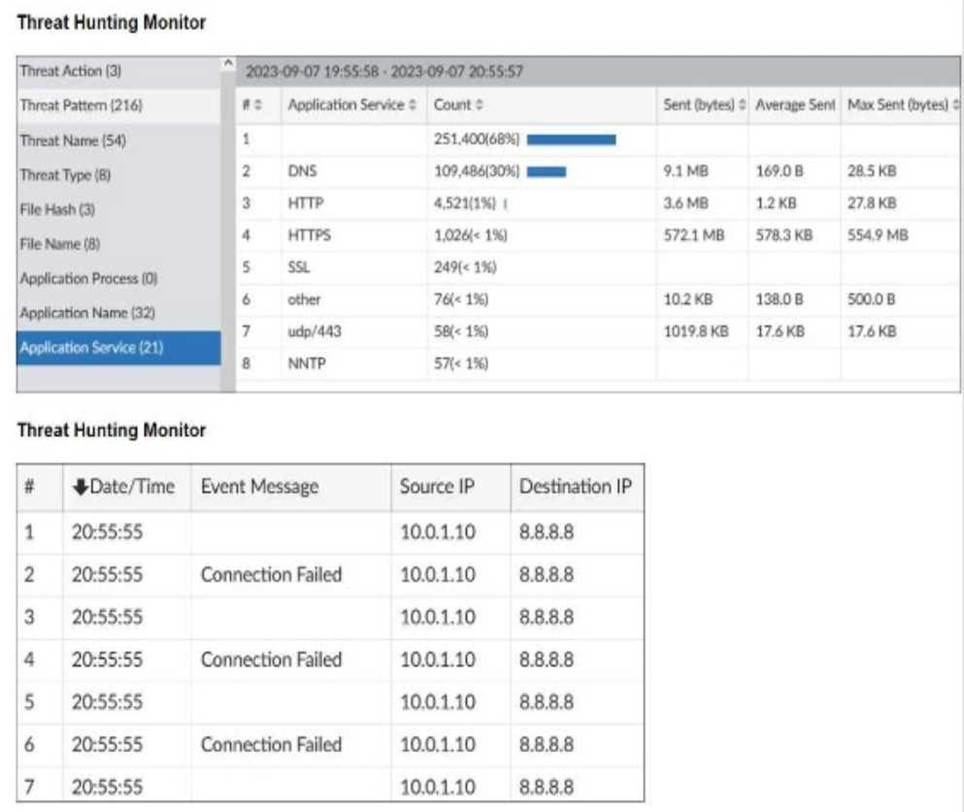
The Threat Hunting Monitor in the provided exhibits shows various application services, their usage counts, and data metrics such as sent bytes, average sent bytes, and maximum sent bytes.
The second part of the exhibit lists connection attempts from a specific source IP (10.0.1.10) to a destination IP (8.8.8.8), with repeated "Connection Failed" messages. Analyzing the Application Services:
DNS is the top application service with a significantly high count (251,400) and notable sent bytes (9.1 MB).
This large volume of DNS traffic is unusual for regular DNS queries and can indicate the presence of
DNS tunneling.
DNS Tunneling:
DNS tunneling is a technique used by attackers to bypass security controls by encoding data within DNS queries and responses. This allows them to extract data from the local network without detection.
The high volume of DNS traffic, combined with the detailed metrics, suggests that DNS tunneling might be in use.
Connection Failures to 8.8.8.8:
The repeated connection attempts from the source IP (10.0.1.10) to the destination IP (8.8.8.8) with connection failures can indicate an attempt to communicate with an external server. Google DNS (8.8.8.8) is often used for DNS tunneling due to its reliability and global reach.
Conclusion:
Given the significant DNS traffic and the nature of the connection attempts, it is reasonable to conclude that DNS tunneling is being used to extract confidential data from the local network.
Why Other Options are Less Likely:
Spearphishing (A): There is no evidence from the provided data that points to spearphishing attempts, such as email logs or phishing indicators.
Reconnaissance (C): The data does not indicate typical reconnaissance activities, such as scanning or probing mail servers.
FTP C&C (D): There is no evidence of FTP traffic or command-and-control communications using FTP
in the provided data.
Reference: SANS Institute: "DNS Tunneling: How to Detect Data Exfiltration and Tunneling Through DNS Queries" SANS DNS Tunneling
OWASP: "DNS Tunneling" OWASP DNS Tunneling
By analyzing the provided threat hunting data, it is evident that DNS tunneling is being used to exfiltrate data, indicating a sophisticated method of extracting confidential information from the network.
Which two types of variables can you use in playbook tasks? (Choose two.)
- A . input
- B . Output
- C . Create
- D . Trigger
AB
Explanation:
Understanding Playbook Variables:
Playbook tasks in Security Operations Center (SOC) playbooks use variables to pass and manipulate data between different steps in the automation process.
Variables help in dynamically handling data, making the playbook more flexible and adaptive to
different scenarios.
Types of Variables:
Input Variables:
Input variables are used to provide data to a playbook task. These variables can be set manually or derived from previous tasks.
They act as parameters that the task will use to perform its operations.
Output Variables:
Output variables store the result of a playbook task. These variables can then be used as inputs for subsequent tasks.
They capture the outcome of the task’s execution, allowing for the dynamic flow of information
through the playbook.
Other Options:
Create: Not typically referred to as a type of variable in playbook tasks. It might refer to an action but not a variable type.
Trigger: Refers to the initiation mechanism of the playbook or task (e.g., an event trigger), not a type
of variable.
Conclusion:
The two types of variables used in playbook tasks are input and output.
Reference: Fortinet Documentation on Playbook Configuration and Variable Usage.
General SOC Automation and Orchestration Practices.