
Practice Free DP-100 Exam Online Questions
You are profiling mltabte data assets by using Azure Machine Learning studio. You need to detect columns with odd or missing values.
Which statistic should you analyze?
- A . Profile
- B . Std deviation
- C . Error count
- D . Type
You create a script that trains a convolutional neural network model over multiple epochs and logs the validation loss after each epoch. The script includes arguments for batch size and learning rate.
You identify a set of batch size and learning rate values that you want to try.
You need to use Azure Machine Learning to find the combination of batch size and learning rate that results in the model with the lowest validation loss.
What should you do?
- A . Run the script in an experiment based on an AutoMLConfig object
- B . Create a PythonScriptStep object for the script and run it in a pipeline
- C . Use the Automated Machine Learning interface in Azure Machine Learning studio
- D . Run the script in an experiment based on a ScriptRunConfig object
- E . Run the script in an experiment based on a HyperDriveConfig object
E
Explanation:
Reference: https://docs.microsoft.com/en-us/azure/machine-learning/how-to-tune-hyperparameters
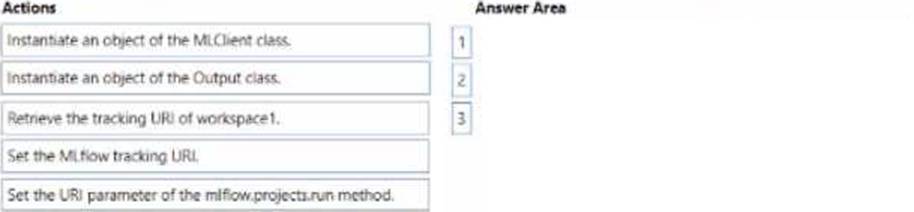
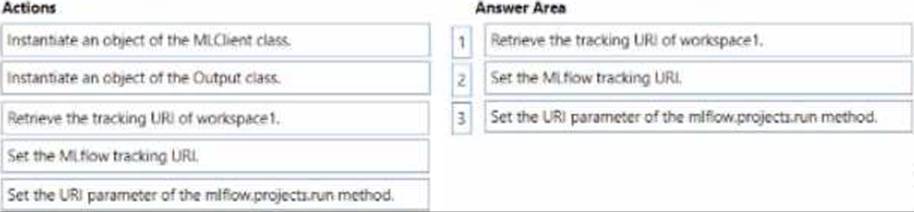
DRAG DROP
You manage an Azure Machine Learning workspace named workspace1 and a Data Science Virtual Machine (DSVM) named DSMV1.
You must an experiment in DSMV1 by using a Jupiter notebook and Python SDK v2 code. You must store metrics and artifacts in workspace 1 You start by creating Python SCK v2 code to import ail required packages.
You need to implement the Python SOK v2 code to store metrics and article in workspace1.
Which three actions should you perform in sequence? To answer, move the appropriate actions from the list of actions to the answer area and arrange them the correctly order.
HOTSPOT
You have a dataset created for multiclass classification tasks that contains a normalized numerical feature set with 10,000 data points and 150 features.
You use 75 percent of the data points for training and 25 percent for testing. You are using the scikit-learn machine learning library in Python. You use X to denote the feature set and Y to denote class labels.
You create the following Python data frames:
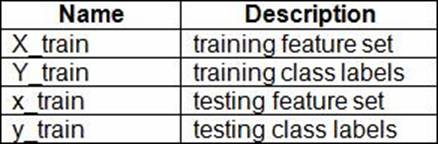
You need to apply the Principal Component Analysis (PCA) method to reduce the dimensionality of the feature set to 10 features in both training and testing sets.
How should you complete the code segment? To answer, select the appropriate options in the answer area. NOTE: Each correct selection is worth one point.
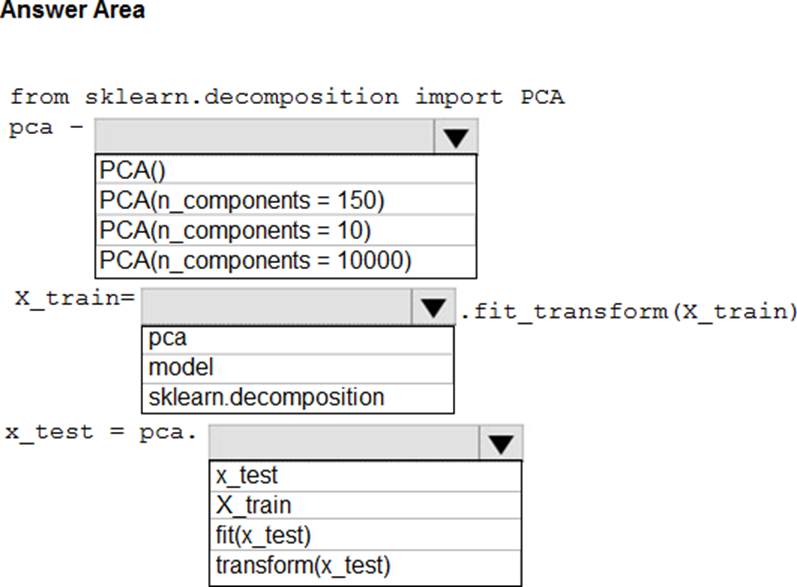
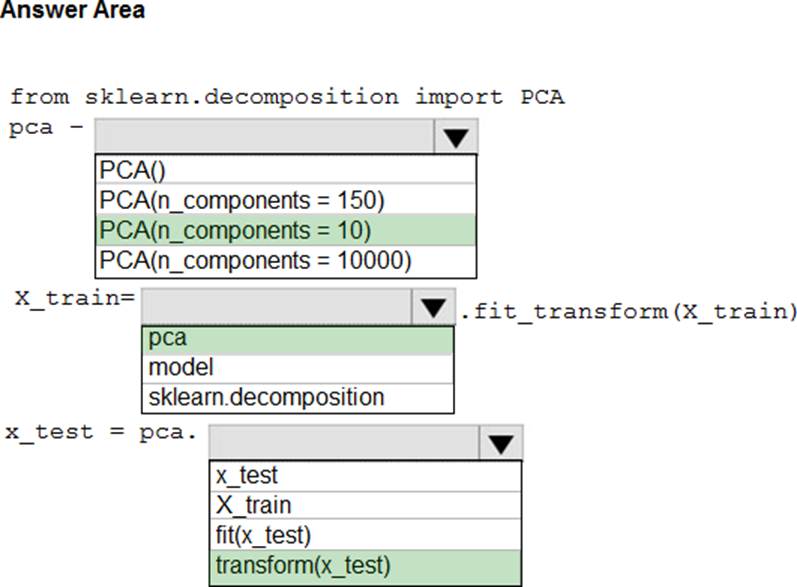
Explanation:
Box 1: PCA(n_components = 10)
Need to reduce the dimensionality of the feature set to 10 features in both training and testing sets.
Example:
from sklearn.decomposition import PCA
pca = PCA(n_components=2) ;2 dimensions
principalComponents = pca.fit_transform(x)
Box 2: pca
fit_transform(X[, y])fits the model with X and apply the dimensionality reduction on X.
Box 3: transform(x_test)
transform(X) applies dimensionality reduction to X.
Reference: https://scikit-learn.org/stable/modules/generated/sklearn.decomposition.PCA.html
You manage an Azure Machine Learning workspace. The Pylhon scrip! named scriptpy reads an argument named training_data. The trainlng.data argument specifies the path to the training data in a file named datasetl.csv. You plan to run the scriptpy Python script as a command job that trains a machine learning model. You need to provide the command to pass the path for the datasct as a parameter value when you submit the script as a training job.
Solution: python script.py Ctraining_data ${{inputs,training_data}} Does the solution meet the goal?
- A . Yes
- B . No
Note: This question is part of a series of questions that present the same scenario. Each question in the series contains a unique solution that might meet the stated goals. Some question sets might have more than one correct solution, while others might not have a correct solution.
After you answer a question in this section, you will NOT be able to return to it. As a result, these questions will not appear in the review screen.
You train a classification model by using a logistic regression algorithm.
You must be able to explain the model’s predictions by calculating the importance of each feature, both as an overall global relative importance value and as a measure of local importance for a specific set of predictions.
You need to create an explainer that you can use to retrieve the required global and local feature importance values.
Solution: Create a TabularExplainer.
Does the solution meet the goal?
- A . Yes
- B . No
B
Explanation:
Instead use Permutation Feature Importance Explainer (PFI).
Note 1:
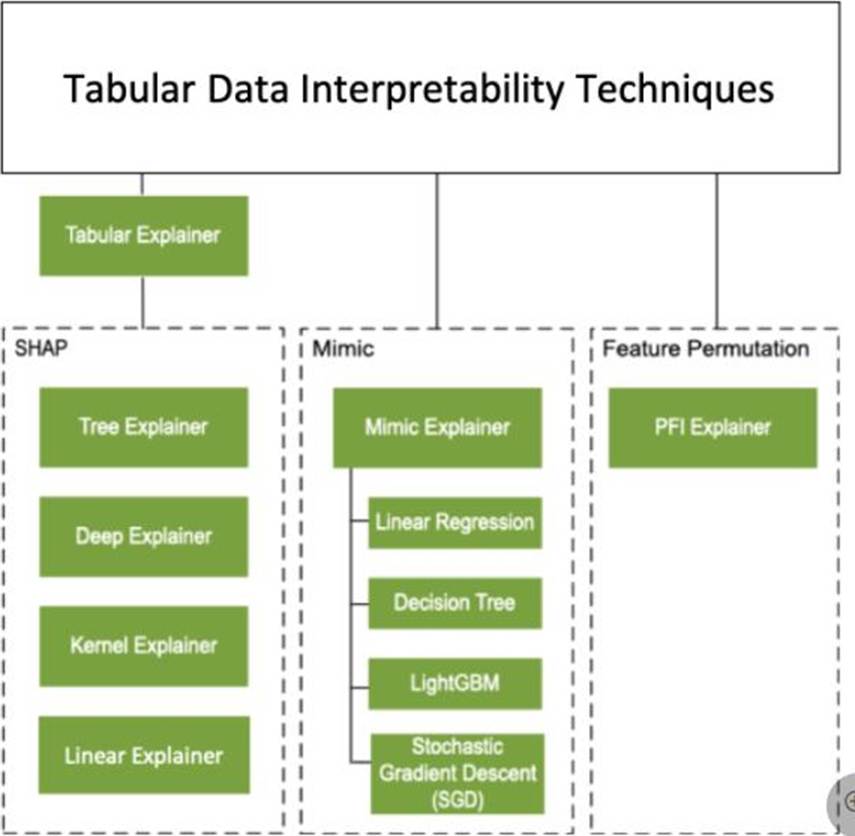
Note 2: Permutation Feature Importance Explainer (PFI): Permutation Feature Importance is a technique used to explain classification and regression models. At a high level, the way it works is by randomly shuffling data one feature at a time for the entire dataset and calculating how much the performance metric of interest changes. The larger the change, the more important that feature is. PFI can explain the overall behavior of any underlying model but does not explain individual predictions.
Reference: https://docs.microsoft.com/en-us/azure/machine-learning/how-to-machine-learning-interpretability
DRAG DROP
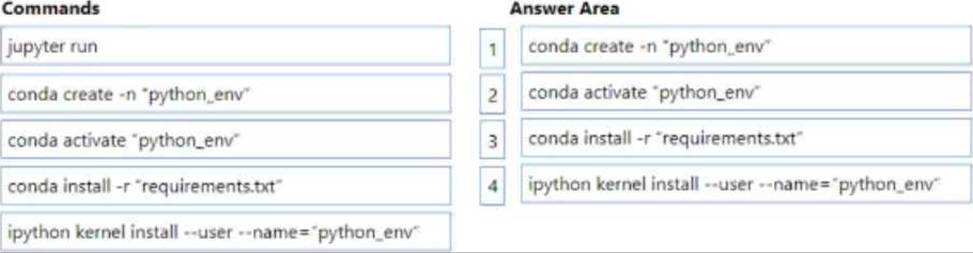
You manage an Azure Machine Learning workspace named workspace1 with a compute instance named compute1. You connect to compute! by using a terminal window from wofkspace1. You create a file named "requirements.txt" containing Python dependencies to include Jupyler.
You need to add a new Jupyter kernel to compute1.
Which four commands should you use? To answer, move the appropriate actions from the list of actions to the answer area and arrange them in the correct order.

HOTSPOT
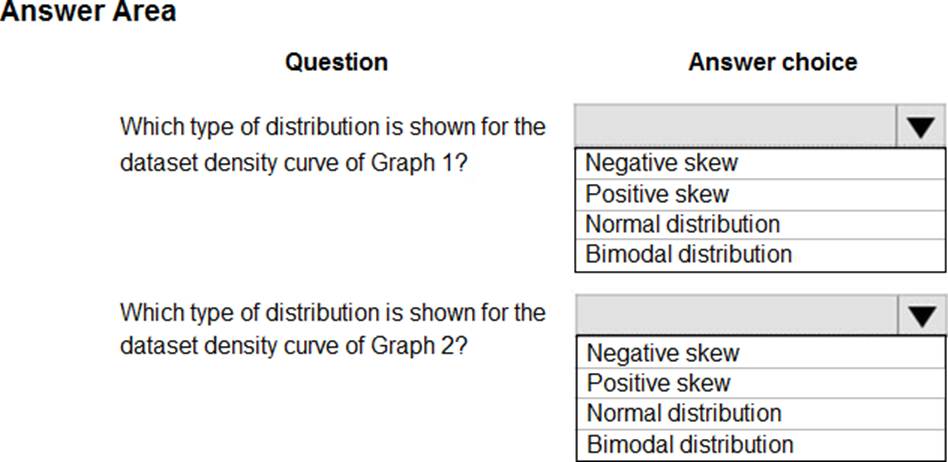
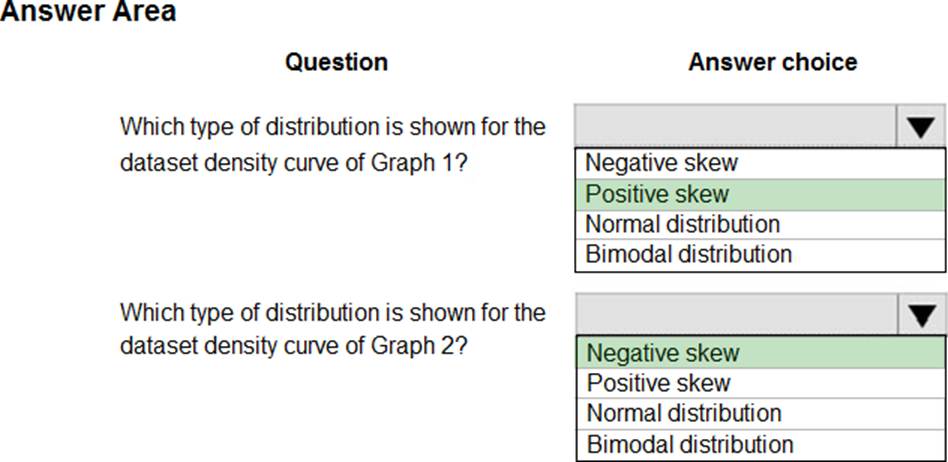
You are analyzing the asymmetry in a statistical distribution.
The following image contains two density curves that show the probability distribution of two datasets.
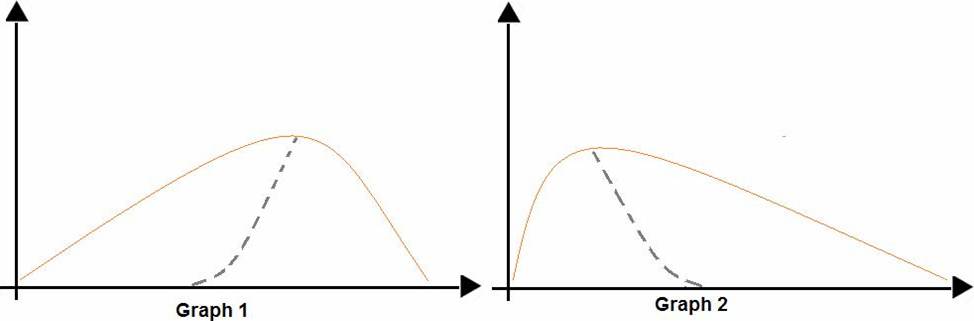
Use the drop-down menus to select the answer choice that answers each question based on the information presented in the graphic. NOTE: Each correct selection is worth one point.
Explanation:
Box 1: Positive skew
Positive skew values means the distribution is skewed to the right.
Box 2: Negative skew
Negative skewness values mean the distribution is skewed to the left.
Reference: https://docs.microsoft.com/en-us/azure/machine-learning/studio-module-reference/compute-elementary-statistics
Note: This question is part of a series of questions that present the same scenario. Each question in the series contains a unique solution that might meet the stated goals. Some question sets might have more than one correct solution, while others might not have a correct solution.
After you answer a question in this section, you will NOT be able to return to it. As a result, these questions will not appear in the review screen.
You are creating a new experiment in Azure Machine Learning Studio.
One class has a much smaller number of observations than tin- other classes in the training set.
You need to select an appropriate data sampling strategy to compensate for the class imbalance.
Solution: You use the Principal Components Analysis (PCA) sampling mode.
Does the solution meet the goal?
- A . Yes
- B . No
B
Explanation:
Instead use the Synthetic Minority Oversampling Technique (SMOTE) sampling mode.
Note: SMOTE is used to increase the number of underepresented cases in a dataset used for machine learning. SMOTE is a better way of increasing the number of rare cases than simply duplicating existing cases.
Incorrect Answers:
The Principal Component Analysis module in Azure Machine Learning Studio (classic) is used to reduce the dimensionality of your training data. The module analyzes your data and creates a reduced feature set that captures all the information contained in the dataset, but in a smaller number of features.
Reference: https://docs.microsoft.com/en-us/azure/machine-learning/studio-module-reference/smote
https://docs.microsoft.com/en-us/azure/machine-learning/studio-module-reference/principal-component-analysis
You are developing deep learning models to analyze semi-structured, unstructured, and structured data types.
You have the following data available for model building:
✑ Video recordings of sporting events
✑ Transcripts of radio commentary about events
✑ Logs from related social media feeds captured during sporting events
You need to select an environment for creating the model.
Which environment should you use?
- A . Azure Cognitive Services
- B . Azure Data Lake Analytics
- C . Azure HDInsight with Spark MLib
- D . Azure Machine Learning Studio
A
Explanation:
Azure Cognitive Services expand on Microsoft’s evolving portfolio of machine learning APIs and enable developers to easily add cognitive features C such as emotion and video detection; facial, speech, and vision recognition; and speech and language understanding C into their applications. The goal of Azure Cognitive Services is to help developers create applications that can see, hear, speak, understand, and even begin to reason. The catalog of services within Azure Cognitive Services can be categorized into five main pillars – Vision, Speech, Language, Search, and Knowledge.
Reference: https://docs.microsoft.com/en-us/azure/cognitive-services/welcome