Practice Free D-DS-FN-23 Exam Online Questions
Only three variables A, B, and C have significant correlation with sales
You build a linear regression model on the dependent variable of sales with the independent variables of A, B, and C. The results of the regression are seen in the exhibit. You cannot request additional data.
What is a way that you could try to increase the R2 of the model without artificially inflating it?
- A . Create clusters based on the data and use them as model inputs
- B . Force all 15 variables into the model as independent variables
- C . Create interaction variables based only on variables A, B, and C
- D . Break variables A, B, and C into their own univariate models
What would be considered "Big Data"?
- A . An OLAP Cube containing customer demographic information about 100, 000, 000 customers
- B . Daily Log files from a web server that receives 100, 000 hits per minute
- C . Aggregated statistical data stored in a relational database table
- D . Spreadsheets containing monthly sales data for a Global 100 corporation
To ensure a successful analytic project, which key role can consult and advise the project team on the value of end results and how these will be used on a daily basis?
- A . Business User
- B . Project Manager
- C . Data Scientist
- D . Business Intelligence Analyst
What is LOESS used for?
- A . It fits a smoothed curve to scatterplot data, to give a general sense of the data’s behavior.
- B . It is a significance test for the correlation between two variables.
- C . It plots a continuous variable versus a discrete variable, to compare distributions across classes.
- D . It is run after a one-way ANOVA, to determine which population has the highest mean value.
During a study to understand the population growth of a certain bacterial culture, you plot the data and identify a quadratic growth trend over time.
Which transformation should you apply to linearize the data?
- A . Square root
- B . Cube
- C . Square
- D . Add a constant
During a study to understand the population growth of a certain bacterial culture, you plot the data and identify a quadratic growth trend over time.
Which transformation should you apply to linearize the data?
- A . Square root
- B . Cube
- C . Square
- D . Add a constant
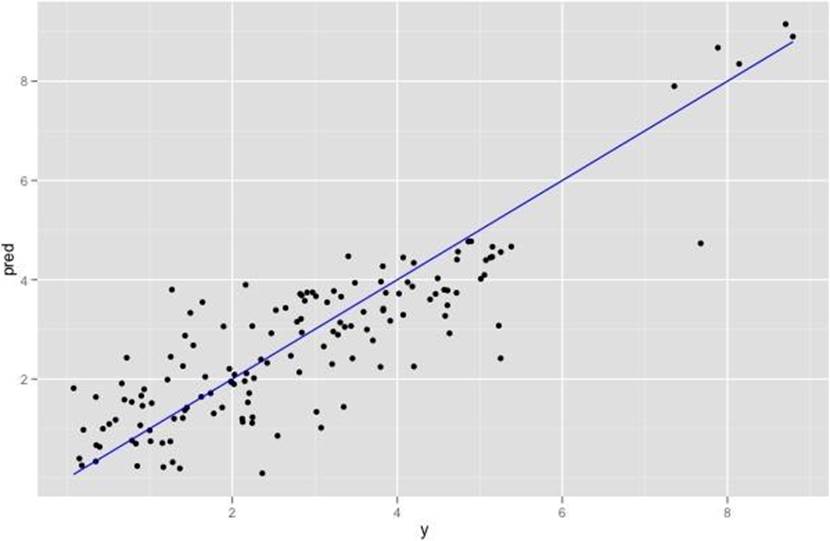
Refer to the exhibit.

You have run a linear regression model against your data, and have plotted true outcome versus predicted outcome. The R-squared of your model is 0.75.
What is your assessment of the model?
- A . The R-squared may be biased upwards by the extreme-valued outcomes. Remove them and refit to get a better idea of the model’s quality over typical data.
- B . The R-squared is good. The model should perform well.
- C . The extreme-valued outliers may negatively affect the model’s performance. Remove them to see if the R-squared improves over typical data.
- D . The observations seem to come from two different populations, but this model fits them both equally well.
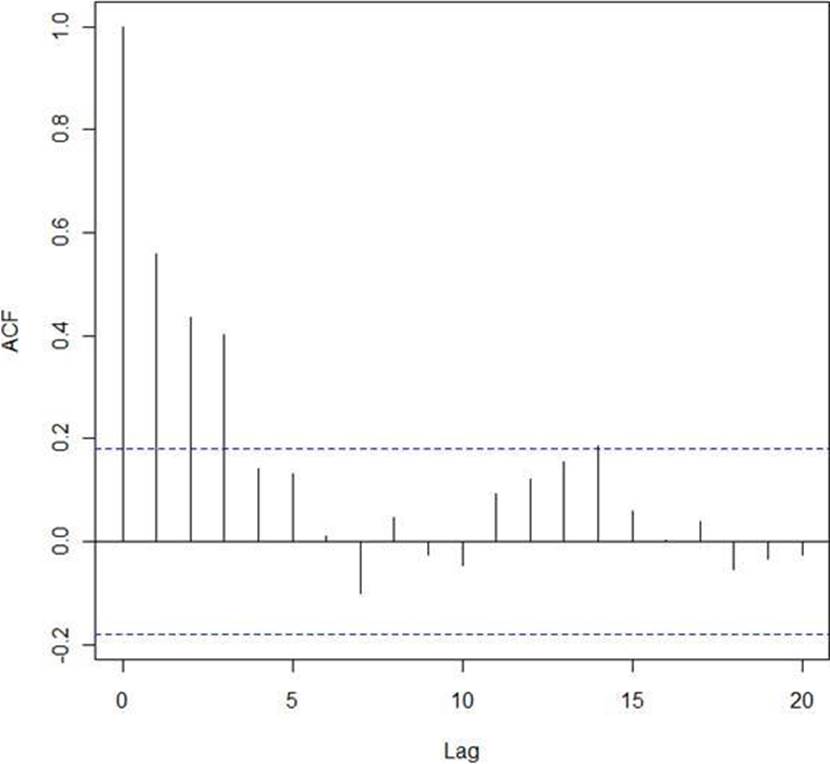
Refer to the exhibit.

In the exhibit, a correlogram is provided based on an autocorrelation analysis of a sample dataset.
What can you conclude from only this exhibit?
- A . There is significant autocorrelation through lag 3
- B . There is no structure left to model in the data
- C . Lag 7 has a significant negative autocorrelation
- D . Differencing is required before proceeding with any analysis
What are challenges presented by Big Data?
- A . New technologies, tools and regulatory rules only
- B . New technologies, tools, business processes, and regulatory rules
- C . New technologies, and tools only
- D . New technologies, tools, and business processes only
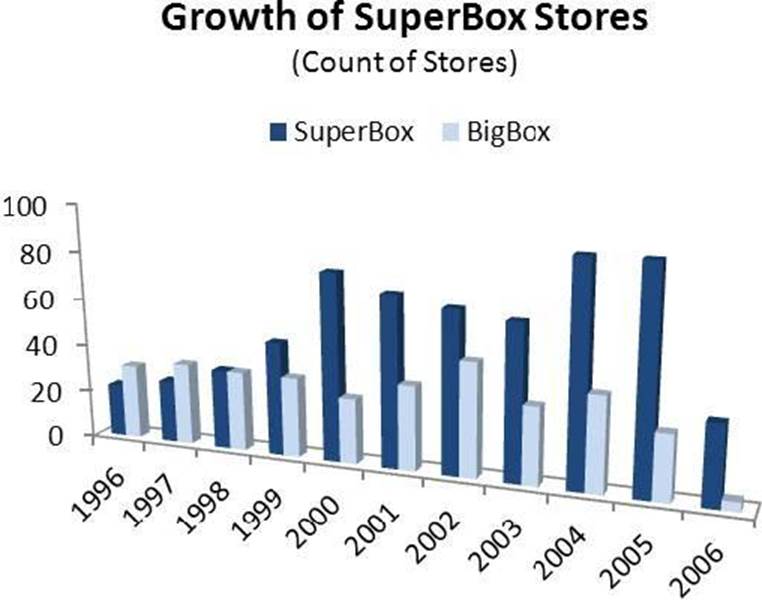
Refer to the Exhibit.

In the Exhibit. For effective visualization, what is the chart’s primary flaw?
- A . The use of 3 dimensions.
- B . The slanting of axis labels.
- C . The location of the legend.
- D . The order of the columns.
