
Practice Free AD0-E208 Exam Online Questions
An analyst is co-creating a report with their client counterpart in preparation for a running marketing performance dashboard. Marketing is still getting onboarded with the analytics tool and hope to begin leveraging data to enable data-driven decisions.
How would the analyst look to share out the dashboard broadly across the team?
- A . Share a PDF at the time the report is completed to the client counterpart and the greater marketing team
- B . Share Can Edit rights with the client counterpart and Can View rights with the entire marketing ® team
- C . Share Can Edit rights with the client counterpart and Can Duplicate rights with the entire marketing team
Several end users have complained that Analysis Workspace is too cluttered with infrequently used variables.
How would the Report Suite Admin Console be used to improve their user experience?
- A . Suggest the team use Data Feeds
- B . Suggest the team use Customize Menus
- C . Suggest the team use Data Warehouse
When changing the Fallout visualization from Eventual Path to Next Hit, the analyst notices that the data reports zero Visitors across the report.
Why would this occur?
- A . Across all visitors, the fallout depicted never was completed as a next step conversion.
- B . Across all visitors, the fallout depicted never was completed as an eventual path conversion.
- C . There was no direct path from the second and third fallout touchpoints.
Which option would an analyst choose to show the percentage change between the two numbers in a visualization?
- A . Use the Summary Change visualization from a Freeform Table, click the Visualization settings, and O select Show Raw Difference
- B . Use the Summary Change visualization, click the Visualization settings, and select Show Percent ,#l Change
- C . Use the Summary Number visualization, click the Visualization settings, and select Percentages
A user needs to share an important segment with a group of users in a Product Profile Group.
Why can’t a member of his Product Profile Group view the segment?
- A . The user forgot to select "Make this segment public".
- B . The user forgot to curate the Segment.
- C . The user only selected "Make this segment public-.
Refer to the exhibit.
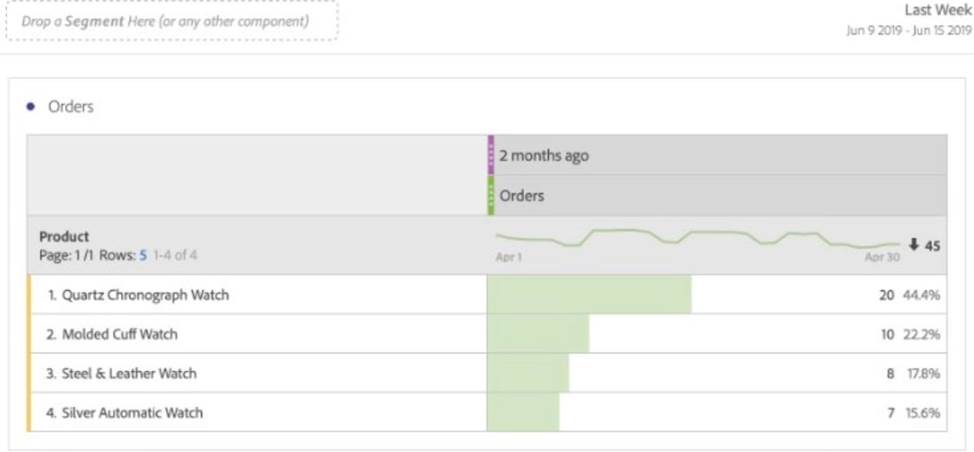
The date range is applied at the panel level, and a different date range is applied on top of
the "Orders” metric.
Which values are displayed in the table?
- A . Product orders recorded last week
- B . Only product orders that have been purchased both two months ago and last week
- C . Product orders recorded two months ago
Consider the following eVar settings:
eVar #: 3
Name: Model Name
Allocation: Most Recent (Last)
Expire After: Visit
Type: Text String
Status: Enabled
An automotive company uses eVar3 to capture "Model Name" on certain model-specific pages of their website. The VP of Marketing expresses a concern about data quality after seeing a report of eVar3 paired with the Visits metric. The report shows a significant number of visits with a Model Name of "Unspecified".
What is causing this issue?
- A . eVar3 is never set due to a tagging error in the page code.
- B . The visits began on a page where eVar3 was not set.
- C . There are too many unique values in eVar3.
An analyst has been given a list of dimensions available to conduct an analysis on their hospital’s doctor site.
The Solution Design Reference (SDR) contains:
eventl – Start Appointment Booking – Set on: Appointment Booking Start
event2 – Booking Complete – Set on: Appointment Booking Complete
eVarl – Doctor Type – Set on: event2
eVar2 – Number of Available Appointments – Set on eventl
propl -Appointment Pathing
Given the SDR, which report can be generated?
- A . Booking Completion Rate
- B . Time to Book an Appointment
- C . Length of Appointments
What is a valid use of a segment as a touchpoint in a Fallout Visualization?
- A . Using a visitor-based segment as a touchpoint inside a visit-context Fallout Visualization
- B . Using a visit-based segment as a touchpoint inside a visit-context Fallout Visualization
- C . Using a visit-based segment as a touchpoint inside a visitor-context Fallout Visualization
An analyst is given a list of specific events a user must take to complete a purchase.
What would be used to see the conversion rate between steps?
- A . Cohort Table
- B . Fallout Visualization
- C . Flow Visualization