Practice Free A00-485 Exam Online Questions
How can you interpret model results using the advanced group-by feature in SAS Visual Analytics?
- A . Analyze the impact of different levels of the group-by variable on the model outcome
- B . Explore interaction effects between the group-by variable and other predictors
- C . Visualize the predicted values for each level of the group-by variable
- D . Review the model coefficients for each level of the group-by variable
Explain what an icicle plot represents in decision tree analysis.
- A . It displays the hierarchical structure of the decision tree.
- B . It visualizes the distribution of data points in each leaf node.
- C . It shows the feature importance for each variable in the tree.
- D . It summarizes the performance metrics of the decision tree.
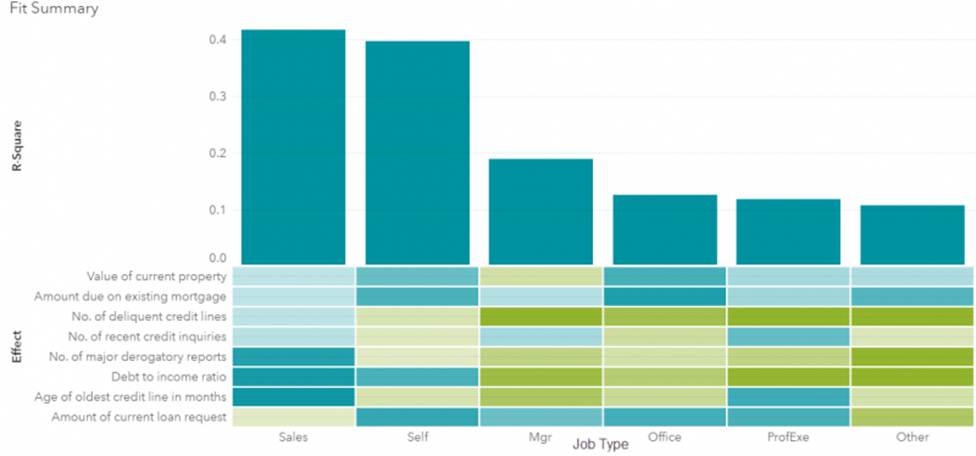
Refer to the fit summary from in the exhibit below.

What can be concluded from the fit summary?
- A . Job Type is not a significant predictor in this model.
- B . Job Type = Office has no important variables associated with it.
- C . Debt to income ratio is a significant predictor when Job Type = Mgr.
- D . Debt to income ratio is a significant predictor when Job Type = Sales.
Which statement is true regarding model comparison within SAS Visual Statistics?
- A . Two generalized linear models cannot be compared if they use different underlying distributions.
- B . Two cluster analyses cannot be compared if they have different initial seed assignments.
- C . A logistic regression and a decision tree cannot be compared.
- D . A linear regression and a generalized linear model cannot be compared.
What are the essentials of logistic regression?
- A . Modeling binary or ordinal outcomes
- B . Estimating probabilities of categorical outcomes
- C . Assuming a linear relationship between predictors and response
- D . Using the logit link function to model the probability of an event
In linear regression modeling, what roles are typically assigned to variables?
- A . Input, Target, and Nominal
- B . Dependent, Independent, and Categorical
- C . Predictor, Response, and Interaction
- D . Intercept, Slope, and Error
Which statement is true for negative binomial and Poisson regression models?
- A . Poisson regression models are used for count data, and negative binomial models are used for binary responses.
- B . The canonical link function for Poisson regression is the log, while for negative binomial it is the logit.
- C . Poisson regression is a special case of negative binomial regression.
- D . Negative binomial models accommodate negative integers while Poisson regression does not.
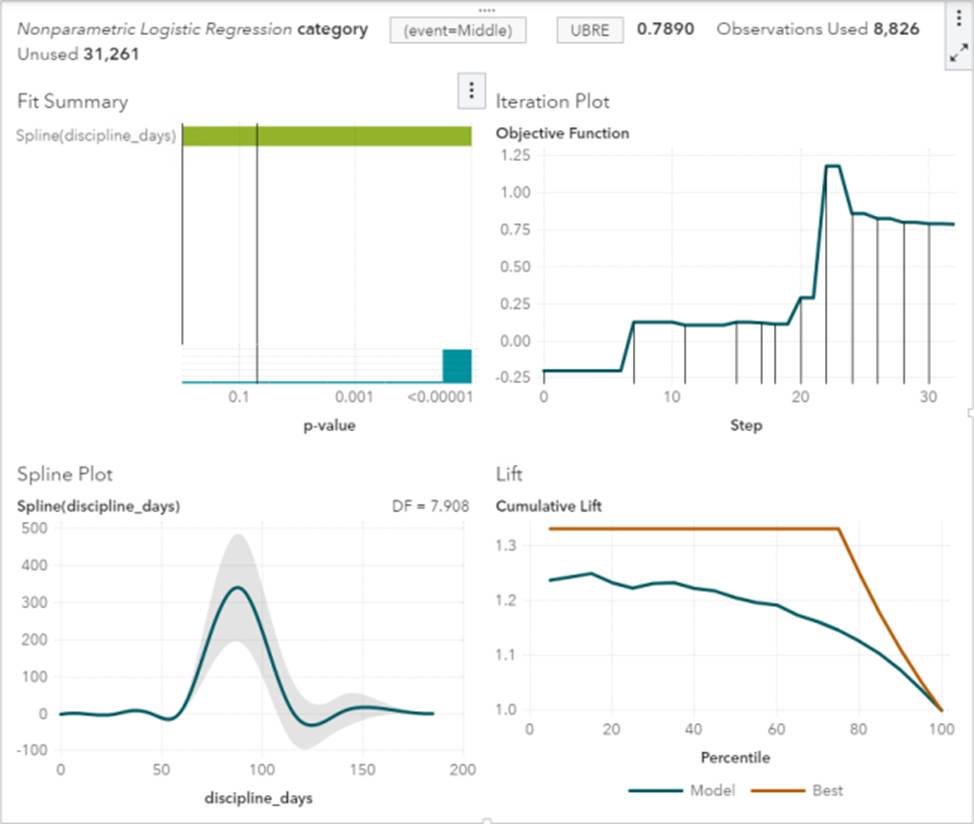
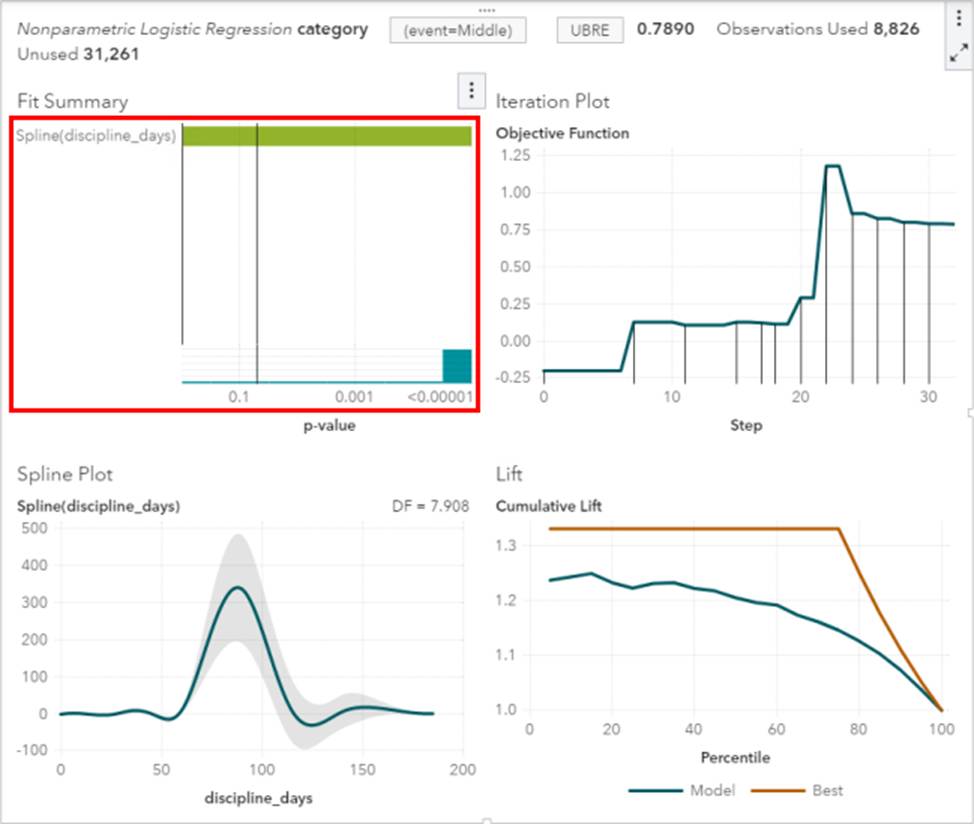
In the below nonparametric logistic regression results display, where would you click to get a plot of significant continuous effects?


When reviewing Measure Details in SAS Visual Analytics, what information can you find related to measures?
- A . Measure name and label
- B . Measure format and informat
- C . Measure data type
- D . Measure calculation method
When exporting score code, what information is typically included in the code?
- A . The entire training dataset
- B . The model parameters and coefficients
- C . Instructions for preprocessing new data
- D . The distribution of the response variable
