
Practice Free A00-485 Exam Online Questions
Refer to the exhibit:
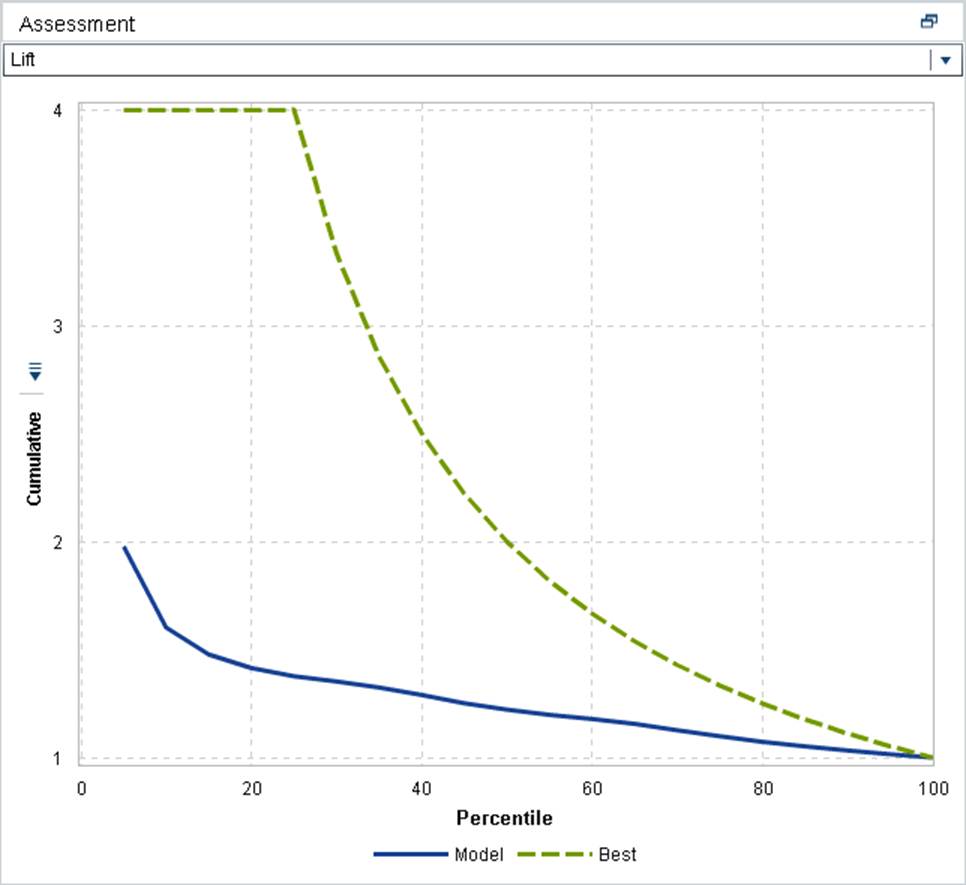
Using the lift chart above to evaluate a decision tree model where the event level is Purchase, what is the expected performance of the model for the best 20% of cases predicted?
- A . About 4 times better than a random sample of the same size
- B . About 1.5 times better than a random sample of the same size
- C . About 1.25 times better than a random sample of the same size
- D . About 1.1 times better than a random sample of the same size
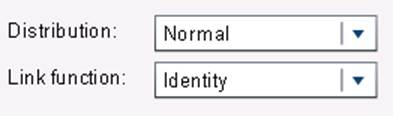
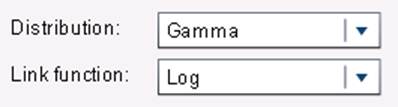
You want to use a generalized linear model to predict donation amount from a set of demographics predictors. Donation amount is known to be right-skewed, with many non-donors (donation amount = 0).
Which settings in the Generalized Linear Model task are most appropriate for modeling this response?
A)
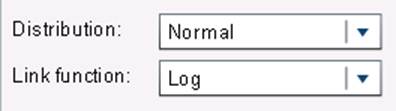
B)
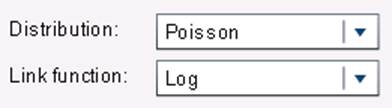
C)
D)
- A . Option A
- B . Option B
- C . Option C
- D . Option D
What is the primary purpose of reviewing the residual plot in linear regression analysis?
- A . To detect outliers in the predictor variables
- B . To assess the linearity assumption and identify potential issues
- C . To determine the p-value associated with the response variable
- D . To calculate the coefficient of determination (R-squared)
What is one advantage of using SAS Studio to score new data with exported score code?
- A . It requires no additional software installation.
- B . It provides advanced visualization capabilities.
- C . It allows for direct integration with Hadoop clusters.
- D . It automatically optimizes the scoring process.
What does the Variable Importance feature help with when choosing the best fitting group-by model?
- A . Identifying the most influential predictors
- B . Assessing the significance of each predictor
- C . Evaluating the multicollinearity among predictors
- D . Understanding the distribution of the target variable
You want to filter out certain observations to analyze their effect on the model.
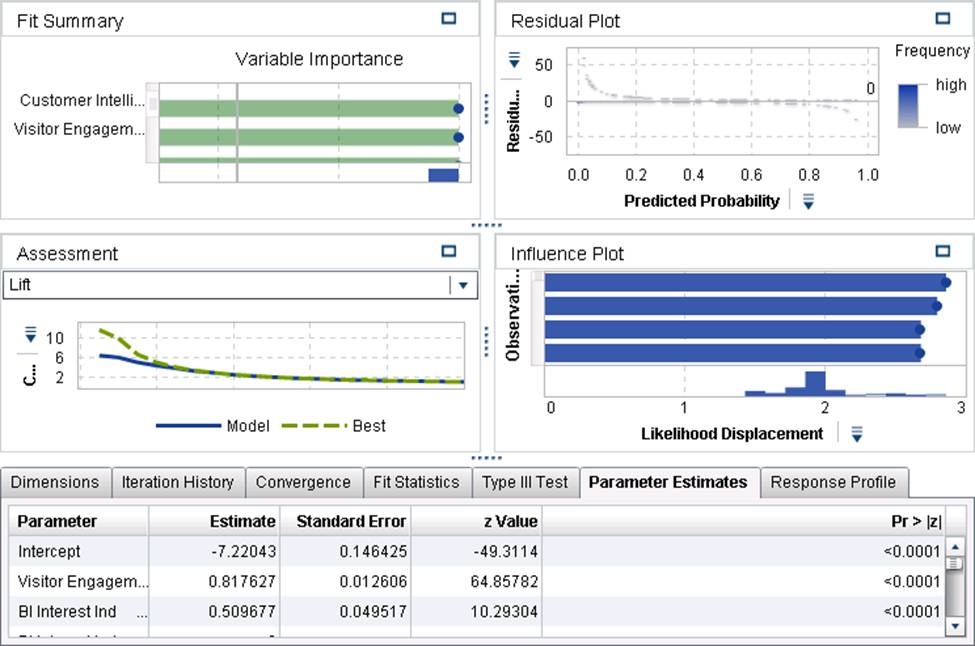
Which windows will achieve this? (Choose two.)
- A . Fit Summary
- B . Residual Plot
- C . Assessment
- D . Influence Plot
How can you interpret a Tree Map in the context of a decision tree?
- A . It visualizes the distribution of data points in leaf nodes.
- B . It displays the hierarchical structure of the decision tree.
- C . It shows the decision boundaries between classes.
- D . It summarizes the performance metrics of the decision tree.
Which statement is true for the Informative Missingness property in SAS Visual Statistics?
- A . Missing values are imputed and indicator variables are created for missing predictors.
- B . Missing values are flagged on diagnostic plots.
- C . A table of missingness patterns for the predictor variables is displayed in the model output.
- D . The user is prompted to fill in a value to impute for missing predictor variables.
What properties can be assigned when comparing models in SAS Visual Statistics?
- A . The number of observations in the dataset
- B . The variables to include in the model comparison
- C . The learning rate for gradient boosting models
- D . The color scheme for visualization
Which modeling technique automatically includes missing values?
- A . Linear regression
- B . Decision tree
- C . Logistic regression
- D . Generalized linear model