Practice Free A00-470 Exam Online Questions
Which statement is true when importing an excel file with multiple work sheets into SAS VA designer
- A . Only one work sheet can be imported at a time from excel files with multiple worksheets
- B . All selected work sheets are imported as separate tables
- C . You cannot import excel files with multiple work sheets
- D . All selected worksheets are imported and concatenated together.
Refer to the bar chart from SAS Visual Analytics Designer
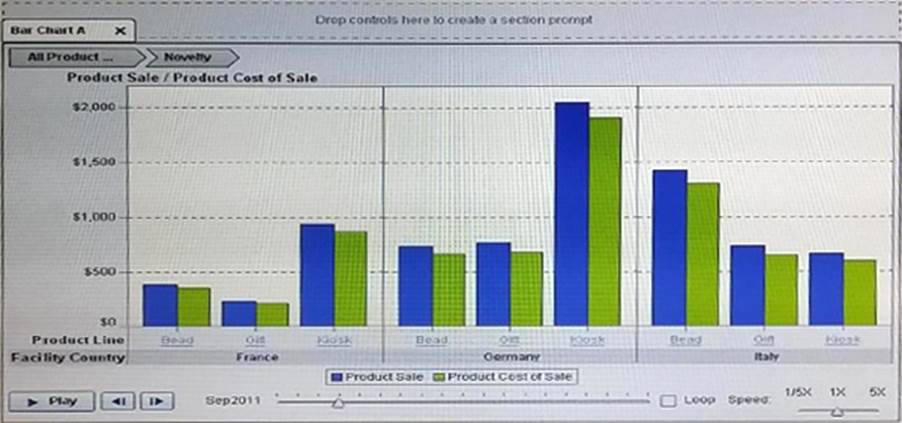
How are data items assigned to the roles for this bar chart?
- A . A hierarchy data item is assigned to the category role and a category data item is assigned to the group role.
- B . To measures data items are assigned to the measures role and a category data item is assigned to the group role.
- C . A Hierarchy data item is assigned to the category role and a category data item is assigned to the lattice columns
- D . A hierarchy data item is assigned to the group role and a datetime data item is assigned to the animation role.
A new calculated item created in SAS Visual Analytics Explorer is based on Which type of Data?
- A . Normalized
- B . Unaggregated
- C . Grouped
- D . Aggregated
Refer to the exhibit:
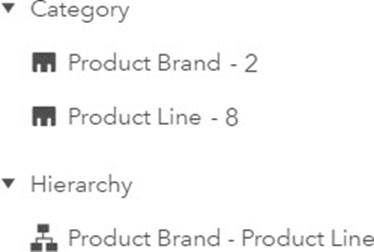
What gets automatically created when the report designer drags the hierarchy into the report prompt area?
- A . A drop-down list for Product Brand.
- B . A button bar for Product Line.
- C . A filter action from Product Brand to Product Line.
- D . Two parameters.
Refer to the exhibit below:
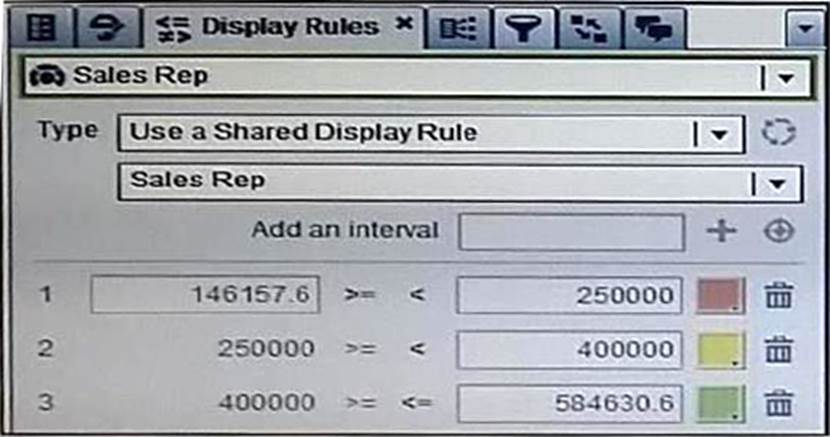
Why are the interval value cells grayed out?
- A . You must use shared rules to edit the values
- B . Once interval values are created they cannot be edited
- C . You must select the row before it comes editable
- D . You do not have permission to edit the report.
Which statements pertaining to multiple data sources in a report are TRUE? (Choose two.)
- A . Each object on a page can use data items from one data source or the other in their roles.
- B . A report prompt can be applied to different data sources if the prompted data item can be mapped between the data sources.
- C . A data filter can use data items from both data sources.
- D . Cardinality thresholds for a report limit the number of rows processed in each of the data sources.
Click the exhibit tab:
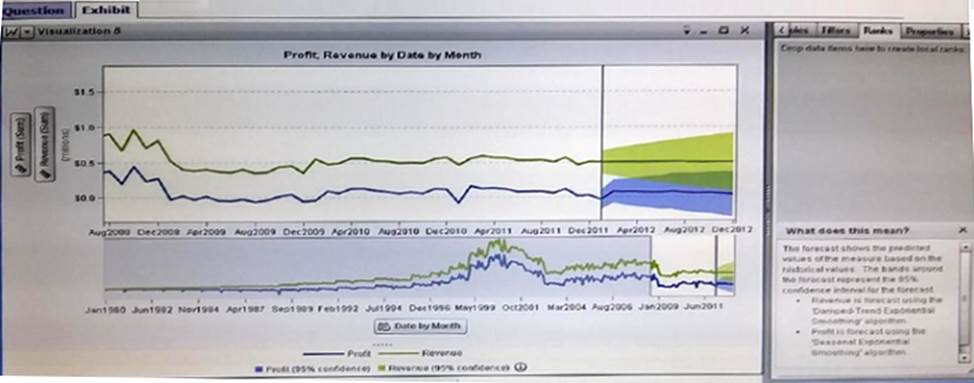
Which action shows the forecasting technique or algorithm used to forecast the data.
- A . Click on the forecast line itself.
- B . Select show data values on the properties tab
- C . Click on the Visualization selector dropdown button
- D . Click on the information icon in the legend
For a cross tab report object created in SAS Visual Analytics Designer, which statement is true?
- A . If a hierarchy data item is assigned to the rows role, no other data items may be assigned to the rows role.
- B . A geography data item that has custom latitude and longitude specified may be added to row data items.
- C . Filters may be applied to both row and column data items, but ranks can only be applied to row data items.
- D . Ascending and descending sorting may be used with both row and column data items but a custom sort can only be used with row data items.
Refer to the exhibit:

Which is TRUE when the Measure heading placement is changed?
- A . Frequency is moved to the rows.
- B . Origin and Frequency are moved to the rows.
- C . The rows and columns are transposed.
- D . Frequency is left justified on the column.
Refer to the exhibit:
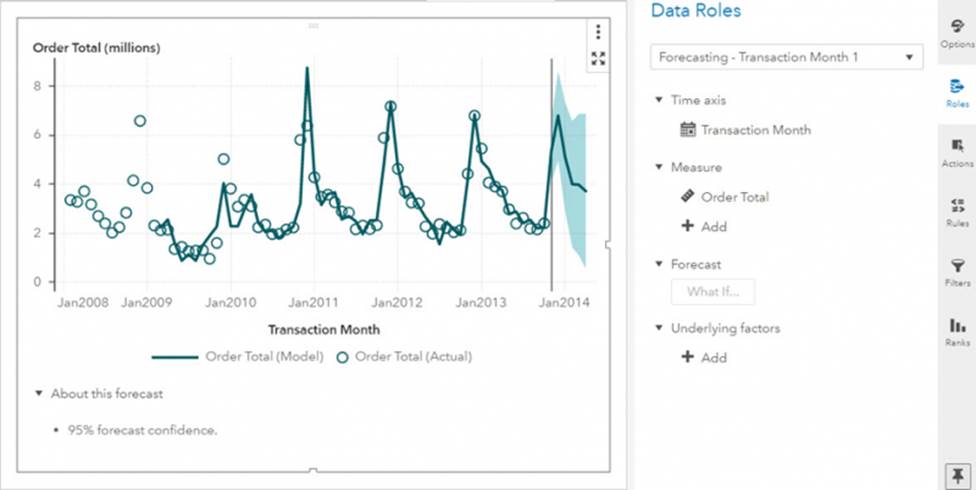
The chart has been filtered to display Year > 2007. The forecast confidence is 95%.
What must you do if you want to enable the What If button in the Roles pane?
- A . Add underlying factors
- B . Expand the forecast horizon
- C . Remove the filter
- D . Increase the forecast confidence
