
Practice Free A00-470 Exam Online Questions
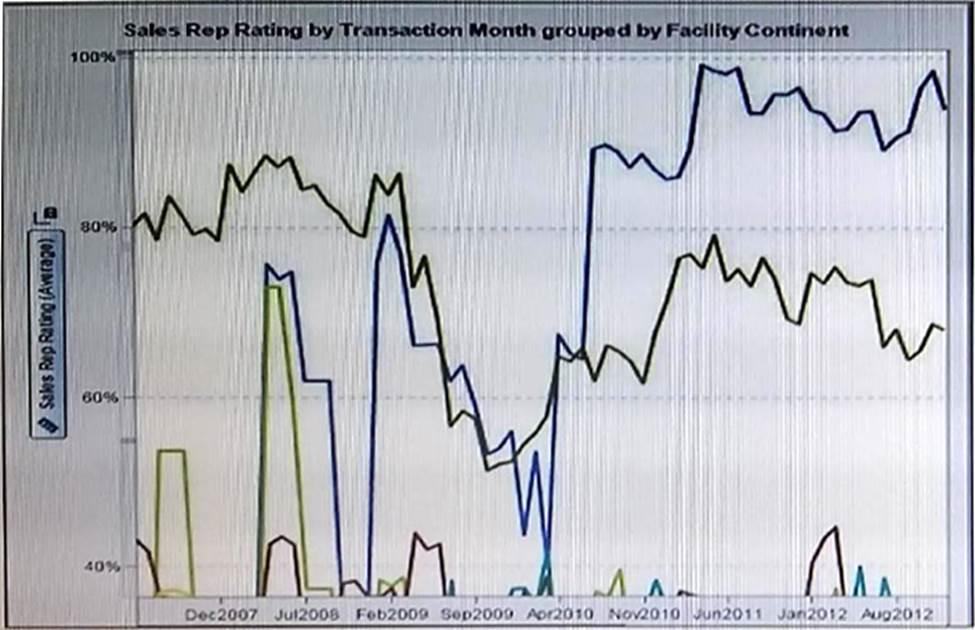
Refer to the exhibit:
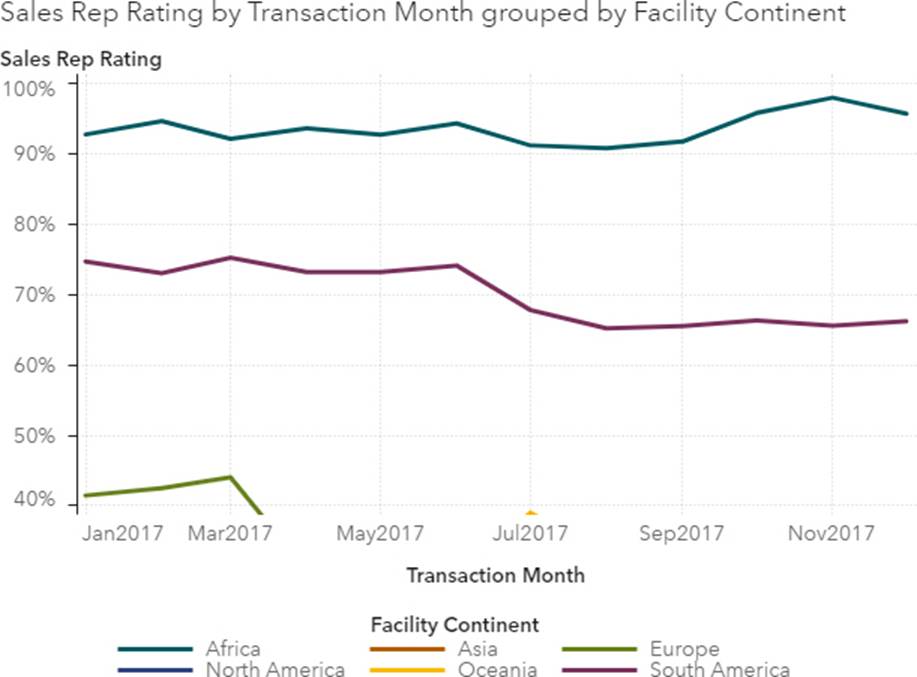
The report designer has just changed the filter to add more data to this line chart.
Why are some of the lines outside of view?
- A . Fixed minimum and maximum has been set on the axis.
- B . The data does not fit.
- C . There is too much data for a line chart.
- D . Data outside of the chart can be ignored.
In SAS VA Designer, all report objects have a property ‘Enable selection in the viewers’. when enabled how does this property affect the report object when viewed on a mobile device?
- A . Users can specify additional properties for the object
- B . Users can rearrange its position in the report
- C . Users can view information about the object
- D . Users can remove the object from the report
Refer the exhibit below:
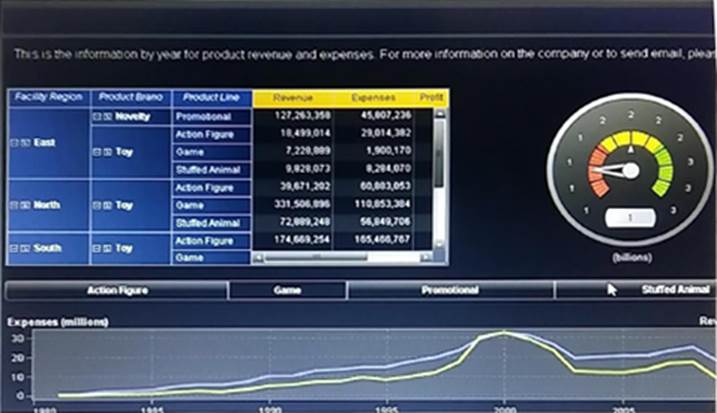
What is the minimum number of report objects required to create this report in SAS Visual Analytics Designer.
- A . 5
- B . 4
- C . 3
- D . 6
Refer to the Exhibit below:
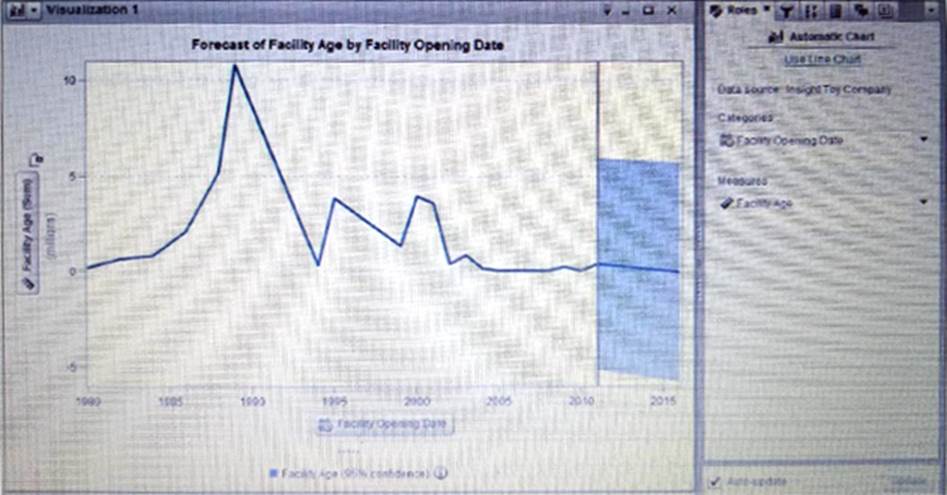
A content Developer created the visualization with a forecast shown above additional measures.
For scenario analysis cannot be added from the roles Tab.
Why?
- A . The Visualization does not allow additional Measures
- B . The Forecast option in a line chart does not allow scenario Analysis
- C . Underlying factors are not available in the line chart Visualization.
- D . The Line Chart was created using the automatic Chart Functionality.
Which statement is true when importing an excel file with multiple work sheets into SAS Visual Analytics Designer
- A . Only one work sheet can be imported at a time from excl files with multiple worksheets
- B . All selected work sheets are imported as separate tables
- C . You cannot import excel files with multiple work sheets
- D . All selected worksheets are imported and concatenated together.
In SAS Visual Analytics Designer, which of the geomap objects supports the animation role?
- A . Geo region map
- B . Geo Coordinate Map
- C . Geo Bubble map
- D . Geo scatter plot map
Refer to the Exhibit below:
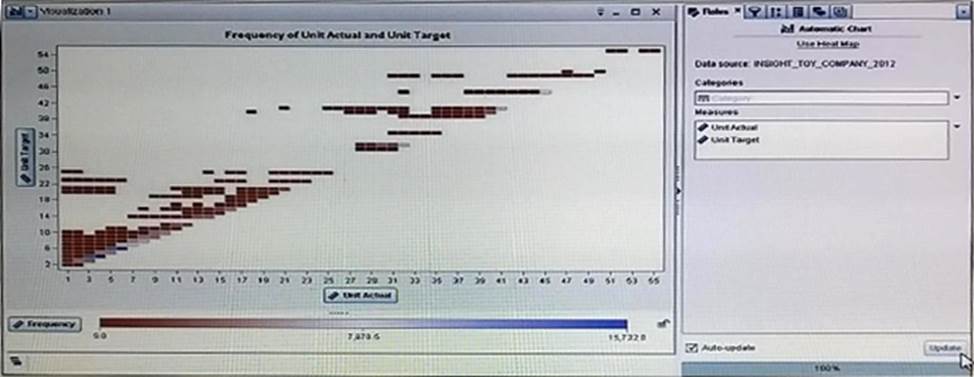
- A . The data item has few unique items
- B . The Heat map visualization was selected on the tool bar
- C . Use Heat map was selected on the roles tab
- D . The data item has high cardinality.
In SAS Visual Analytics Explorer, when a date data item is dragged onto an Automatic Chart visualization either a bar chart or a line chart will be created.
What determines the type of chart created?
- A . The format applied to the date data item determines the type of chart displayed.
- B . A bar chart is created if the Model property of the data item is set to Discrete, and a line chart is created if the Model property is set to Continuous.
- C . The properties associated with the automatic chart determines the type of chart displayed.
- D . A line chart is created if the Model property of the data item is set to Discrete, a bar chart is created if the Model property is set to Continuous.
Refer to the exhibit below:
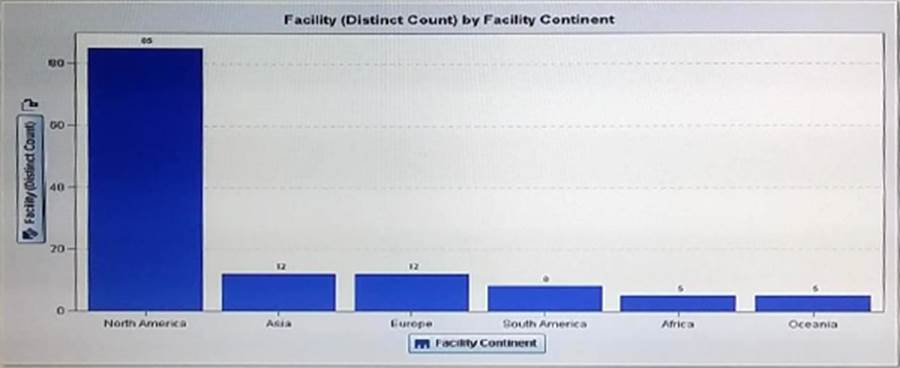
How does the content developer create the facility (Distinct Count) data Item?
- A . Change the classification property of Facility content to distinct count measure
- B . Change the aggregation of Facility to Distinct count
- C . Create a new custom category that displays the distinct count
- D . Right click on Facility and select create Distinct count
The content developer has just changed the filter to add more data to this line chart in SAS visual analytics Explorer, are some of the lines outside of view?
- A . The data does not fit
- B . Data Outside of the can be ignored
- C . there is too much data for a line chart
- D . The vertical Axis is locked